

Bradford District Local Plan - Publication Draft (Regulation 19) (October 2026)
Section 3: Spatial Strategy and Strategic Policies Comment
3.1 Introduction
3.1.1Strategic Policies perform an important function in plan-making and set the overall pattern, scale and quality of development for the plan. It is important that the plan through strategic policies establishes the key strategic priorities building upon the vison and objectives for the area and a clear policy starting point for non-strategic policies.
3.1.2The strategic policies in this section cover the overall spatial strategy and growth requirements for the local plan (SS1 and SS2). The section then details strategic policies to deliver sustainable development, movement and connectivity (ST1 and ST2), focusing then on climate resilience, environmental sustainability and resource use (ST3) whilst creating well designed and healthy places (ST4). The section concludes the strategic policies with Green Belt (ST5) and the Green and Blue Infrastructure network (ST6).
3.1.3The strategic policies set out in this section should be read with the plan as a whole and in particular with section four (thematic policies) and where relevant the implementation, delivery and monitoring policies under section six.
3.1.4The key diagram is set out at the end of section 3.
Spatial Strategy
POLICY SS1: Spatial Strategy Comment
Ambition
- To deliver sustainable development and change to meet the needs of local communities and businesses to 2043 through the delivery of the plan vision, strategic objectives, policies, site allocations and designations.
- To support a balanced approach to growth which seeks to maximise urban regeneration opportunities but provides space for growth across the district’s settlements while protecting and enhancing the built and natural environments.
- To continue to build partnerships, stakeholder relationships and work with communities to support investment, housing and economic growth.
Growth and Investment
- Planning decisions as well as plans, strategies, programmes and investment decisions will seek to transform the economic, environmental, physical and social conditions of the district through:
Sustainable Urban Growth
- Prioritising housing growth within and on the edge of existing sustainable urban areas including the Regional City as set out through the settlement hierarchy in s.6 of this policy and distribution of growth detailed in Policy SS2, sustaining access to a wide range of services and facilities, with support for the retention and enhancement of physical, social and environmental infrastructure.
- Maximising opportunities and densities for housing and employment growth near rail stations, transit and public transport corridors to enhance quality and efficiency and accessibility of sustainable transport infrastructure and active travel networks.
- Supporting new sustainable transport infrastructure investment to assist with strengthening district connectivity and the transition towards a low carbon future.
- Focusing medium and longer term transformational physical change, regeneration activities and housing and economic growth within the Broad Locations of Growth identified as Regeneration Areas of Bradford City Centre, Keighley, Shipley and Holme Wood.
- Support a heritage-led approach to the sensitive reappropriation and reuse of historic mill sites and industrial architecture to act as a driver for housing, economic growth and regeneration of areas.
- Support the renewal of existing housing estates by identifying opportunities for physical and infrastructure improvements and housing investment.
Unlocking Economic Growth
- Continue to support the development of the Regional City as a globally connected hub for economic innovation, skills and learning, digital connectivity and enterprise and build upon the economic strengths of the towns of Keighley, Ilkley, Bingley, Baildon, Queensbury and Silsden while strengthening the economic diversification of villages and rural areas in accordance with Policies TC1, TC2, EC4 and EN8.
- Inclusive and sustainable growth of the Bradford district economy, including supporting key sectors including education, investment in Employment Zones, new growth opportunities and linking communities to economic benefits including jobs, skills and training.
- Take advantage of existing economic, community and cultural strengths, tourism assets and locational advantage to further support the growth of arts, culture and visitor sector enterprises.
- Support the retention, diversification and vitality of city, town centres, district and local centres as a location for everyday services and facilities while avoiding the proliferation and over concentration of uses which may have a negative health impact on local communities.
Places, Community and Environment
- Sustain the diversity and unique characteristics of the district’s varied towns and villages, their setting and quality of place through a cohesive approach to sustainable settlement planning.
- Ensure that developments are of high quality and well designed and that they contribute to inclusive built and natural environments which protect and enhance local settings, and heritage and reinforce or create a sense of place, local character, community and distinctiveness, supported by high-quality infrastructure.
- Support the delivery of healthy places, improving people’s health and wellbeing and helping reduce health inequalities, by planning sustainable, resilient and well-connected places where people want to live and work.
- Ensuring a move towards a greener economy and a resilient lower energy and low carbon future by minimising the district’s exposure to environmental threats and mitigate impacts through adaptation and building resilience.
- Protect and enhance the district’s environmental resources including areas of international and national importance, such as the South Pennine Moors, the character and qualities of the district’s heritage, landscape and countryside, open spaces and green and blue infrastructure.
- Avoid increasing flood risk, and manage land and river catchments for flood mitigation, renewable energy generation, biodiversity enhancement and increased tree cover.
Land Use and Prioritisation
- Through site allocations and in compliance with relevant policies in the Local Plan and the Framework to meet housing and employment needs during the plan period, give priority to:
- firstly, the development of deliverable or developable Previously Developed Land and buildings within settlements, then
- the development of deliverable or developable Greenfield sites within settlement boundaries, then
- the development of sustainably located deliverable or developable previously developed land in the Green Belt, then
- the release and development of sustainably located deliverable or developable Grey Belt land and then finally
- the release and development of sustainably located deliverable or developable Green Belt land.
- Ensuring an efficient use of land through the application of density standards as set out within Policy HO2.
Settlement Hierarchy
- The settlement hierarchy which established the role, function and levels of growth for settlements within the district is set out below:
- 1st Tier - The Regional City of Bradford (with Shipley) as the most sustainable settlement will be the prime focus for housing, employment, retail, leisure, education, health and cultural activities and facilities in the district. To support this principal role and function, the Regional City will see the greatest proportion of housing development.
- 2nd Tier - The towns of Keighley, Ilkley, Bingley, Baildon, Queensbury and Silsden as sustainable settlements with higher levels of populations and access to excellent levels of services and facilities, including public transport will play a significant role in supporting their surrounding areas and will see generally a higher level of growth subject to settlement characteristics and environmental constraints.
- 3rd Tier – The large and medium villages of Burley in Wharfedale, Menston, Steeton with Eastburn, Thornton, Cottingley, Haworth (& Cross Roads), Addingham, Cullingworth, Denholme, Oakworth and Wilsden with access to good levels of services and facilities serving a largely local population will see a level of growth proportionate to their function, settlement characteristics and environmental constraints.
- 4th Tier – The small villages of East Morton, Harden and Oxenhope with more limited services and facilities will see the lowest levels of housing growth to help sustain local economies and provide local housing choice.
- 5th Tier – Washed over Green Belt settlements will not be subject to housing allocations and will be subject to Policies NE8 and NE9.
- The proportion of housing development for settlements within each tier of the hierarchy is set out in Policy SS2 and within section 5 of the plan through settlement area policies and site allocations.
Explanation
3.1.5The spatial strategy sets out the key directions for the development of the district during the plan period and connects to other strategic policies and provides a framework to the plan structure alongside SS2 which details specific information on growth levels and targets.
Sustainable Urban Growth
3.1.6There is a need over the plan period to capitalise on the existing strengths of the district and unlock potential to improve the quality of life, prosperity and health of current and future generations. Economic, social and environmental progress has been uneven across the district and there has been a failure to build upon the potential of the Regional City of Bradford and Keighley in particular.
3.1.7The often degraded fabric of urban areas requires a comprehensive and clear strategy to ensure urban renewal and living appeals to a wide and diverse range of residents, not only in terms of urban housing types but also the quality of the wider environment and public realm- open spaces, services and facilities, places for recreation and leisure, safe and healthy streets which are well managed with a sense of place and quality.
3.1.8But the city is once again building in confidence – a city on the rise - following its spotlight as a UK City of Culture with the opening of Bradford Live, continued success of the Alhambra Theatre, upgrade and investment to the National Science and Media museum and a new Brit-school inspired college. The development of Norfolk Gardens in the heart of the city centre, the opening of the new Darley Street indoor market and move from concept to delivery of the 1000 home city village scheme presents a positive vision for the city.
3.1.9The spatial strategy continues to place regeneration at scale within the heart of the plan spatial strategy through focusing 70 percent of housing growth in and around the Regional City – creating a critical mass and new period of sustained housing and economic growth. This is aligned to ambitions to substantially improve the connectivity of the city and district overall through investment in new rail and transit infrastructure.
3.1.10Building a clear housing delivery pipeline and stimulating further physical transformation and investment through a series of regeneration areas in the City Centre, Shipley, Holme Wood and Keighley create substantial opportunities for new housing and business development and features through Southern Gateway one of the largest physical regeneration projects in the country.
3.1.11Looking wider with its Victorian stone architecture, former mills and industrial architecture presents a unique opportunity to place heritage-led regeneration at the heart of the district’s transformation - building distinctive and diverse new neighbourhoods. This will undoubtedly require a critical mass of longer range vision, investment and conviction, but the benefits are potentially substantial.
3.1.12Ensuring that transport planning and planning for new homes and communities go hand in hand the plan looks to maximise lower carbon growth opportunities along key public transport and active travel corridors. The plan takes advantage of proximity to transport hubs to increase housing density on brownfield regeneration sites within the city centre but also on the edge of the city, towns and other locations, subject to wider environmental and character constraints.
3.1.13A creative approach to place planning reveals opportunities to change how we view urban housing – the range and types of housing to meet very diverse housing needs and improve the urban fabric of the district.
3.1.14Despite the opportunities, Bradford has some of the highest deprivation levels in the country and there is an urgent need to continue to tackle day to day challenges of health inequalities, lower performing educations, skills, training and low income. The renewal of existing housing estates, such as Holme Wood provide scope to improve physical environments while creating healthier places and wider access to employment and improved services and facilities. But it is only the start.
Unlocking Economic Growth
3.1.15The Council’s adopted growth strategy Built Different Bradford 2025-2035 Regeneration & Growth Plan places a strong emphasis on the growth foundations of culture, transport, skills and regeneration to underpin a number of physical growth accelerators including Southern Gateway and transforming towns; major infrastructure projects and City Village. There is a clear focus upon the links between physical transformation and economic prosperity, including linking people and skills development to the growth agenda.
3.1.16As an engine for growth in West Yorkshire and one of the eight English ‘Core Cities’ Bradford faces significant challenges around its labour market structure, income levels and educational attainment. While the economy is characterised by relatively strong employment participation rates, its economic outputs and productivity are behind other core cities[1]. The economic activity rate in 2024/25 (71.4%) is below the national figure for the same period (78.8%) and while total employment has grown from 2011-24 by 5.5% (12,000 jobs) this is significantly below the growth rate for England as a whole over the same period (18.3%), with job density (0.66) is below the England rate (0.86).[2]
3.1.17The Insight Bradford Sector Study November 2025 identifies sector strengths and a series of specialisms which are considered important to the growth of the economy including opportunity sectors. The key findings from this study are detailed below in Box SS1.1.
Box SS1.1: Bradford District Economy – Existing Strengths and Opportunities to Grow
Existing strengths with opportunities to grow
- Bradford’s advanced manufacturing and material sector is large and specialised. Employment in the sector has however been falling faster than national levels.
- Food and drink accounts for a significant number of jobs and there are slightly above average levels of employment specialism. The sector is also growing.
Opportunity Sectors
- Digital and technologies is a priority sector nationally and regionally and whilst the sector is not specialised relative to national levels it does underpin a number of other sectors. Sub-sector strengths – manufacturing, engineering, consultancy, RF clusters (space and satellite)
- Culture and creativity – sub sector strengths – publications, cultural education, recreation activities and museum activities.
- Financial and business services – crucial sector employing 1 in 10 workers – sub sector strengths in financial services, back-office operations, head office / management consultancy.
Other Important Sectors
- Energy – no overall strengths but focus upon investment in hydrogen, industrial decarbonisation and clean energy sector locally.
- Life science (health) – potential strength in manufacturing of medical and dental instruments.
- Logistics and distribution – scope to develop as a key logistics hub and supporting sub-sectors in food logistics and other supporting activities.
- Transport – hugely important local sector – support for move to new forms of transport including sustainable or innovative forms of transport.
3.1.18Updates to the Employment Land Review, indicates a period of transition in national economic policy (reindustrialisation focus) and local economic strategy in supporting regeneration and new sector-led growth while balancing the retention and growth of traditional economic businesses. A hybrid economic scenario underpins the Local Plan which utilises economic forecasting and historic take-up to:
- Retain a baselined level of focus upon offices (13% of total ‘b class’ need) against a backdrop of city and urban transformation with a move to class A offices and supporting facilities to grow voluntary, professional and financial services alongside wider regeneration areas and projects.
- An uplift from baseline economic forecasts in Research and Development (R&D) to support new and emerging growth sectors and priorities (3.26% of b class need)
- An uplift from baseline forecasts in storage and distribution (40.27% of b use need) in recognition of logistics and distribution strengths.
- The application of a forecast forward historic take-up rate for industrial land (43.25%) which recognises the district’s strengths in manufacturing, transport and other traditional employment sectors.
3.1.19Within this diverse economic context, the spatial strategy seeks to:
- Allocate land to meet the needs of emerging economic sectors, support the expansion and growth of existing business and focus upon locational strengths in logistics and distribution through the allocation of new strategic and large-scale employment sites at Esholt, Nufarm and Holme Wood.
- The allocation of a range of smaller and medium sized sites in locations attractive to the market to support the retention and development of local businesses.
- Focus other economic growth within a series of re-profiled sustainably located Employment Zones as a focus for floorspace intensification, cost effective small business space and local business relocations.
3.1.20The education sector has a critical role play in supporting regeneration but also tackling Bradford’s transition from a lower income / lower skilled economy to one which matches business requirements and high growth expectations. The plan focuses upon the relationship with further and higher education facilities within the Bradford City Centre and Keighley in particular – as hubs for regeneration and skills development. The Local Plan also looks to make the connections between physical change, building, physical development, skills gaps, business requirements and opportunities to support local communities to access the benefits of regeneration activity.
3.1.21The Local Plan also takes a supportive policy framework to the development of tourism and visitor, arts and cultural sectors – supporting a wide range of enterprise and businesses across the district, including tourism hotspots in Saltaire, Wharedale, Airedale and the Pennine Towns and Villages. Bradford’s visitor economy exceeded the £1bn mark in 2025 supported by City of Culture status with 12.13m visitors welcomed across the district and supporting almost 9,000 FTE jobs[3].
3.1.22Often overlooked or underplayed due to the transition in purchasing patterns to online retail, the district’s wholesale markets and huge and diverse range of centres – local, district, town and city, play an essential role in the heart of many communities and support local jobs. The spatial strategy continues to focus upon the importance of these locations to the economy and often changing, sometimes hybrid role in terms of delivering online derived services while continuing to deliver traditional functions and supporting Bradford’s diverse communities.
Places, Community and Environment
3.1.23The district is large and diverse and in terms of land area it is mainly ‘rural’ in character featuring a mix of towns and villages with their own character and setting within the wider West Yorkshire landscape. Approximately 66% of the district is rural in nature and home to 20% of the district’s population. Maintaining the quality, defining features and a sensitive approach to the place-led growth of towns and villages is a fundamental pillar of the spatial strategy. This is supported through settlement policies which frame growth within the wider context of sustaining and improving local services, facilities, infrastructure and recognising key characteristics, constraints and sustainable growth opportunities.
3.1.24It is important that we harness the strengths and resources of rural areas to the benefit of the district as a whole and to develop a viable future for rural communities. There is a need to ensure that the countryside is enhanced and sustains the natural, cultural and historic environment of the district. Haworth and Bronte Country to the west of the district are of significant cultural significance for example. Using appropriate materials and a good quality of design is important to safeguarding and enhancing local character.
3.1.25Delivering growth in the district through the plan period can and should go hand in hand with quality design and place-making. The spatial strategy is concerned with raising the bar in design quality across all sites and the plan is supported by a progressive set of policies that build upon design guidance and integrate new standards for housing to ensure adaptability and accessibility within high-quality living environments.
3.1.26The district offers a high-quality natural environment, including green flag award winning public parks and gardens and moorland countryside. The character and qualities of the countryside need to be protected and enhanced in their own right, as well as for the important species and habitats they include. Effective environmental stewardship is vital in ensuring that local people have access to local services this is important to the quality of life experienced by rural communities.
3.1.27More efficient low carbon and active travel movement patterns will be required to support a competitive economy, healthier lifestyles and a quality environment. Many parts of the district continue to need to be restructured and the legacies left by past industrialisation addressed. The industrial age has provided a very rich and distinctive character and heritage to the district and had a marked effect on communities and the physical environment.
3.1.28Pressures on our environmental assets and resources are likely to increase with the demands for growth. The district is particularly susceptible to a number of environmental threats such as flooding, atmospheric pollution and soil degradation, as well as the multi-faceted impacts of climate change. Positive, responsible environment management will be vital to safeguard and improve our environment, including air quality, and the well-being of people in the district.
Land Use and Prioritisation
3.1.29With finite land and resources the spatial strategy looks to maximise opportunities to re-use existing land and resources to accommodate growth over the next 18-20 years. This also requires a clear view on how places can be connected and neighbourhoods reformed to support sustainable growth – not just the development of brownfield sites in separation to their wider context.
3.1.30There is also a clear focus in the spatial strategy on ensuring the efficient use of land across all types of land and areas, requiring a net gain in biodiversity, appropriately increased levels of density in housing and ensuring that good design leads to quality layouts, streets, open spaces and a real sense of place. There needs to be a net benefit in place-making that significantly offsets the loss of land from other uses.
3.1.31In assessing and allocating land for housing and employment, the spatial strategy seeks to exhaust the pool of sustainable previously developed sites and then move through a sequence of land types in order of preference before the supply of land meets its need requirements. Through this process there is a requirement for a detailed assessment of sites and their various constraints as set out in the site assessment methodology and an evaluation of place-making directions at a settlement or area scale to arrive at preferred site options.
3.1.32Just over 63% of the housing site allocations in the Local Plan are on non-Green Belt locations, or about 12,000 units.[4] Just under 37% of the site allocations (or 7039 dwellings) are in locations which will be removed from the Green Belt to accommodate growth. Due to the availability of land and the specific characteristics of settlements, the Regional City and Airedale settlements have the highest levels of non-Green Belt allocations at 70.18% and 76.32% respectively. The Pennine Towns and Villages are at about 27% non-Green Belt but the Wharfedale settlements drops to 3.42% due to very little opportunities for development on previously developed land. With the application of allowances for urban regeneration areas on top of allocations the percentage of housing growth classified as non-Green Belt increases to approaching 80% in the Regional City and Airedale areas.
3.1.33Despite a very significant focus in the spatial strategy on urban regeneration and maximising previously developed land opportunities and other land within settlements where appropriate, it is clear from the work on site assessments and pool of sites that in order to meet housing (and employment need which has similar constraints over availability of suitable brownfield sites and land within settlements) that there is an exceptional circumstances case to release Green Belt land for growth of the scale set out, which is further detailed in SS2 and Green Belt policy ST5.
Settlement Hierarchy
3.1.34The use and articulation of a settlement hierarchy in guiding and controlling the distribution of growth and development is a well-established planning tool with its roots in the RUDP and historically the Regional Spatial Strategy (RSS) and plays a major role in establishing a sustainable pattern of growth and development across the district. While broadly in line with the approach of the RSS, the Core Strategy made some adjustments to the overall settlement hierarchy approach to include Bingley as a Principal Town and introduced a tier of ‘Local Growth Centres’ between the Principal Towns and much smaller Local Service Centres following a detailed settlement study and the practicalities of the land supply situation at the time.
3.1.35The settlement hierarchy has been further revisited in light of a review of population and services and facilities in an updated settlement study and under the spotlight of Green Belt assessments which requires more specific definition of the status of towns and villages in particular following changes to national policy and guidance on Green Belt and introduction of the concept of Grey Belt.
3.1.36The settlement hierarchy therefore now has a specific classification of simply the regional city, towns (various sizes) and villages (various sizes) within defined population groupings, with assessment of services and facilities and an evaluation of their overall function and role. This has led to some adjustments to the classification of settlements between tiers but broadly overall the structure is similar to the settlement hierarchy applied over numerous previous plans.
3.1.37The City of Bradford and the towns of Ilkley, Keighley, Bingley, Baildon, Queensbury and Silsden need to provide a strong focus for local communities, in terms of service provision and employment and housing opportunities. Other settlements have the potential to grow in a managed and sustainable way in particular the large and medium villages which will help to promote greater self-sufficiency in rural areas. The settlement study provides details on:
- Population profiling
- Grouping of settlements by population profiling
- An assessment of services and facilities utilising evidence findings
- An evaluation of key constraints and opportunities at a settlement level
- Finalised classification of settlements with the hierarchy
3.1.38Policy SS2 sets out further detail in the distribution of growth across the settlement hierarchy which has been informed by a review of population proportionality and reasonable alternatives.
|
Strategic Objectives |
All Strategic Objectives |
|
Key Policy Links |
SS2, ST1, ST2, ST3, ST4, ST5, ST6 |
|
Evidence Base |
POLICY SS2: Growth Requirements Comment
Meeting Housing Requirements
- Between the period 2025/26 and 2042/43 the Local Plan will seek to deliver a minimum total of 33,669 dwellings (net). The requirement for housing is set at a level which would represent a significant boost in housing delivery.
- The Local Plan will deliver housing through the provisions set out in Policy HO1 and meet affordable housing and specialist housing and accommodation needs including Gypsy and Traveller and Travelling Showperson needs at detailed within Policies HO4, HO6 and HO7.
- In addition to providing for the growth identified above the Council will continue to take a positive and flexible approach to additional growth opportunities including the delivery of transformational change in and around Broad Locations for Growth identified as Regeneration Areas (RA) and the reuse of previously developed land within settlement boundaries.
Components of Housing Supply
- To meet housing requirements for the period 2025/25-2042/43 this will be made through the sources of supply outlined within Table SS2.1.
Table SS2.1 Housing Supply
|
Sources of Supply |
Housing Number |
% of Land Supply |
|
Under Construction and Planning Permissions |
||
|
Sites under construction and forecast to deliver within the plan period |
5,208 |
|
|
Sites with extant planning permission and forecast to deliver within the plan period – minus 10% for non-implementation |
1,631 |
|
|
Sub-total (A) |
6,839 |
20.31% |
|
Windfall Allowance |
||
|
Windfall (non-RA areas) – years 4-18 at a rate of 250 per annum |
3,750 |
|
|
Clearances - years 4-18 at a rate of 30 per annum |
-450 |
|
|
Sub-total (B) |
3,300 |
9.80% |
|
Site allocations and broad locations for growth (Regeneration area allowances) |
||
|
Site allocations |
19,040 |
|
|
Broad Locations of Growth (Regeneration Area Allowance) |
6,000 |
|
|
Allocation and Allowances Buffer (6%) |
-1502 |
|
|
Sub-Total (C) |
23,538 |
69.91% |
|
Combined Land Supply (A+B+C) |
33,677 |
|
|
Housing requirement |
33,669 |
|
|
Surplus |
+8 |
- To meet housing requirements the Plan allocates land for 12,001 dwellings on non-Green Belt land and a Major Developed Site (MDS1) in the Green Belt and releases Green Belt land for the allocation of 6,889 dwellings to accommodate new development as set out in the Settlement Policies and Policies Map.
- The housing trajectory illustrating the expected rate of housing delivery over the plan period is set out in Appendix 13.
Distribution of Housing Growth
- Housing growth will be planned, distributed and managed in accordance with the vision, objectives and spatial priorities and policies set out in the Plan, reflecting a balanced and sustainable growth strategy aligned to the available land supply, the Council’s priority Regeneration Areas and the settlement hierarchy.
- Table SS2.2 below details the non-discounted distribution of housing within the district across the plan period, which consists of sites under construction, extant planning permissions, site allocations and Regeneration Area Allowances. Windfall allowances outside of Regeneration Areas is not detailed within Table SS2.2.
Table SS2.2: Distribution of Housing Growth (Non-discounted)
|
Settlement Hierarchy |
Housing Distribution |
% of Distribution |
|
Regional City (Tier 1) |
||
|
Bradford City Centre (BCC) |
10,332 |
|
|
Bradford North-East (BNE) |
2,407 |
|
|
Bradford North-West (BNW) |
3,291 |
|
|
Bradford South-East (BSE) |
2,934 |
|
|
Bradford South-West |
2,897 |
|
|
Shipley |
1,229 |
|
|
Sub Total |
23,090 |
72.02% |
|
Towns (Tier 2) |
||
|
Keighley (large town) |
2,401 |
|
|
Ilkley (medium town) |
689 |
|
|
Bingley (medium town) |
817 |
|
|
Baildon (medium town) |
190 |
|
|
Queensbury (small town) |
838 |
|
|
Silsden (small town) |
651 |
|
|
Sub Total |
5,586 |
17.42% |
|
Villages (Tier 3) |
||
|
Burley in Wharfedale (large village) |
577 |
|
|
Menston (large village) |
188 |
|
|
Steeton with Eastburn (large village) |
234 |
|
|
Thornton (large village) |
621 |
|
|
Cottingley (large village) |
170 |
|
|
Haworth (& Cross Roads) |
252 |
|
|
Addingham (medium village) |
208 |
|
|
Cullingworth (medium village) |
147 |
|
|
Denholme (medium village) |
240 |
|
|
Oakworth (medium village) |
84 |
|
|
Wilsden (medium village) |
311 |
|
|
Sub-Total |
3,032 |
9.46% |
|
Villages (Tier 4) |
||
|
East Morton (small village) |
38 |
|
|
Harden (small village) |
47 |
|
|
Oxenhope (small village) |
65 |
|
|
Sub Total |
150 |
0.47% |
|
Outside of Settlements |
202 |
0.63% |
|
Grand Total |
32,060 |
100% |
Meeting Employment Land Requirements
- Between the period 2025/26 and 2042/43 the Local Plan will seek to deliver at least 110.5ha of employment land to meet needs.
- The Local Plan will deliver employment land and floorspace through the provisions set out in Policies EC1 and EC2.
Components of Employment Land Supply
- To meet employment land requirements this will be made through the sources of supply outlined within Table SS2.3.
Table SS2.3 Employment Land Supply
|
Sources of Supply |
Eg(i) (Offices) (ha) |
Eg(ii) (R&D) (ha) |
Eg(iii) (General Industrial / Residential Compatible) (ha) |
B2 (ha) (General Industrial) |
B8 (ha) (Storage & Distribution) |
Total |
|
Under Construction and Planning Permissions |
||||||
|
Sites under construction and forecast to deliver within the plan period |
0.16 |
0.2 |
0.94 |
0.84 |
2.28 |
4.42 |
|
Sites with extant planning permission and forecast to deliver within the plan period |
0.11 |
0.13 |
0.95 |
5.93 |
7.84 |
14.96 |
|
Sub-Total (A) |
0.27 |
0.33 |
1.89 |
6.77 |
10.12 |
19.38 |
|
Site Allocations and Land Intensification |
||||||
|
Site Allocations (net) |
9.67 |
7.05 |
7.46 |
30.88 |
27.19 |
82.25 |
|
Forecast Employment Zones Intensification Uplift |
0.43 |
0 |
4.7 |
4.45 |
9.58 |
|
|
Sub-Total (B) |
10.1 |
7.05 |
43.04 |
31.64 |
91.83 |
|
|
Combined Land Supply (A) + (B) |
10.37 |
7.38 |
51.70 |
41.76 |
111.21 |
|
|
Employment Land Requirements |
14.6 |
3.6 |
47.8 |
44.5 |
110.5 |
|
|
Supply v Need Balance |
-4.23 |
+3.78 |
+3.9 |
-2.74 |
+0.71 |
|
- Opportunities to further increase floorspace to meet office (Eg(i)) needs will be supported within Regeneration Zones, Employment Zones and established employment areas.
- Proposals for the development of storage and distribution (B8) to meet needs will be supported within Employment Zones and established employment areas.
- To meet local employment requirements, the Plan releases two sites from the Green Belt in Bradford South-East which are identified on the Policies Map and details are provided in the Bradford South-East Settlement Policy and Site Allocations within Section 5 of the Plan, totalling 43.72ha. These are:
- E57: Land North of Westgate Hill and West of Tong Lane (9.06ha gross and 5.44ha net), and
- E157: Nufarm South (34.66ha gross[5] and 22.12ha net)
- Land for employment uses is allocated at the Major Developed Site in the Green Belt as identified on the Policies Map and details as provided in the Bradford North-East Settlement Policy and Site Allocations within section 5 of the Plan, as:
- MDS2: Esholt Wastewater Treatment Works South (27ha gross / net)
- To meet local employment needs, site allocations are identified on the Policies Map and within Section 5 of the plan to provide a mixed portfolio of new employment land supporting the economic expansion of local businesses, retention of local jobs, and attract new investment into the district, as detailed in Policy SS1 and EC1.
Explanation
Housing Needs and Requirement
3.1.39The Framework (2024) (Paragraph 62) states ‘to determine the minimum number of homes needed, strategic policies should be informed by a local housing need assessment. In addition to the local housing need figure, any needs that cannot be met within neighbouring areas should be taken into account in establishing the amount of housing to be planned for’.
3.1.40The Government Standard Method (SM) has been used to determine the minimum assessment of Local Housing Need (LHN) which is based upon a formula that incorporates a baseline of local housing stock which is then adjusted upwards to reflect local affordability pressures to determine the starting point for consideration of the minimum number of homes to be planned for over the plan period. It is an unconstrained assessment of housing need.
3.1.41The SM figure changes annually as housing stock and affordability ratios vary and the Local Plan total local housing need includes two calculations of SM – one for the first year of the plan (2025/26) – based upon the SM figure of 1,845 per annum and a second calculation figure (1,872 per annum) from 2026 onwards based upon updated MHCLG and ONS datasets. The combined minimum local housing need over the plan period is therefore: 1 year of 1,845 plus 17 years of 1,872, totalling 33,669. Specific technical information on the SM calculation is included within the SHMA 2026.
3.1.42The SM figure is below the Core Strategy housing requirement of 2,476 dwellings per annum, but above the 1,704 dwellings per annum proposed in the emerging Regulation 18 Local Plan. They are both figures relating to different plan periods, different calculation methodologies and different land supply contexts.
3.1.43The housing requirement for the Local Plan is set at the same level as the calculated Local Housing Need with no specific requests received by neighbouring authorities to help meet unmet housing needs. While the Local Plan has a strong investment focus the local infrastructure and economic growth ambitions are likely to lead to a jobs level (if following the 1,628 jobs per annum calculation as detailed in the Employment Land Review Addendum 2026) that supports a lower jobs-derived ‘housing need’ than SM.[6]
Meeting Various Housing Needs
3.1.44The SHMA 2016 sets out a wide range of strategic themes, gaps and opportunities and includes a strong focus upon affordable housing and meeting the net shortfall of 759 affordable dwellings per annum and the importance of delivering a balanced range of homes to meet local needs including for larger households and to tackle overcrowding.
3.1.45The SHMA also includes a clear native about widening the range and housing and specialist accommodation to support an ageing population profile through the plan period and meeting other specialist needs including for Gypsies and Travellers. The SHMA also needs to be read alongside the Local Supported Housing Strategy to address supply, quality, supported-living need and move-on pathways for young people, care leavers and people with complex needs.
3.1.46Policy SS2 supports various detailed housing policies in the Plan on meeting a wide range of needs – including Policies HO4 (Affordable Housing), HO6 (Supported and Specialist Housing) and HO7 (Gypsy, Traveller and Travelling Showpersons Accommodation).
Components of Housing Supply
3.1.47To meet the housing requirements across the plan period this is delivered through a range of different forms of housing supply with assumptions which are set out below detail.
Dwellings Under Construction (UC)
3.1.48These are residential units which are identified as under construction at the start of the Local Plan base date (1st April 2025). This type of housing land supply is generally more certain in terms of delivery and for the district as a whole totalled 5,208 units at the base date. This is a net figure which has removed losses such as demolitions.
Extant Planning Permissions (PP)
3.1.49Are sites with planning permission which generally consist of full or detailed permissions of all sizes and small outline permissions with net yields of 1-4 dwellings. The delivery of sites with planning permission is less certain than developments under construction and can be impacted by non-implementation. From an empirical analysis of data on non-implementation rates detailed within the CBMDC Housing Technical Paper (2026) this equates to an average of about 10% across the district as a whole. The planning permissions at the base date consisted of 1,812 units against which a 10% non-implementation rate has been applied to calculate broadly the considered effective supply – which equates to 1,631 units.
Windfall Allowance and Clearances
3.1.50A windfall allowance (for sites not specifically identified in the Plan) is included within the anticipated land supply calculation for areas outside of Regeneration Zones based upon historic windfall delivery rates and expected future trends. The basis for the per annum calculation rate is included within the Housing Technical Paper and is applied from Year 4 of the plan on the basis that at the start of the plan period most land supply is ‘known’ for a period time. The windfall allowance is also discounted in reflection of forecast clearances or residential demolitions during the plan period. This analysis is often trend based and has been historically associated with the loss of tower blocks and replacement with lower density housing resulting in a net loss. More detailed information is now available on potential demolitions, and this has informed the per annum estimates. Clearances are applied from the same year in the plan as the windfall allowance. The total windfall allowance net of clearances is 3,300 units.
Housing Allocations
3.1.51These include sites which at the time of the base date did not have a planning status or had outline planning permission only and were able to deliver a site yield of 5 units or over (net).[7] Site allocations have been subject to a robust multi-layered assessment process starting with a review through the Strategic Land Assessment (SLA) followed by the application of a detailed Site Assessment Methodology integrating updated plan evidence and an evaluation of strategic settlement planning considerations. Site allocations are also supported where available by information on delivery through the collation of deliverability questionnaires and other market information. The allocations are broadly split into deliverable (years 1-5 of the plan) and developable (years 6 plus), and each site has been profiled in terms of delivery dates to inform the overall housing trajectory within Appendix 13 of the Plan.
3.1.52The breakdown of housing allocations in the plan by yield and size is detailed within the supporting text to Policy HO1. It highlights the significant number of sites falling within a yield of 10-49 units (131 sites) and that this equates to over 50% of the total number of housing site allocations. Again over 50% of the sites within the plan are small in size (0.19-1ha) which totals about 138 allocations. This provides a strong basis for supporting smaller housebuilders and developers but the reliance on larger sites is more limited – often informed by the physical make-up of the district and topographical, landscape and environmental constraints.
Broad Locations for Growth / Regeneration Areas
3.1.53In compliance with the Framework para 72b), the Local Plan identifies on the key diagram Broad Locations for Growth, set out as Regeneration Areas for parts of the Regional City (including City Centre) and Keighley for years 6 plus of the Plan. These locations are forecast to be subject to very significant physical change in some cases and enhancement in other parts to support growth through a coordinated approach to transport and investment funding during the Plan Period. Table 1 below sets out the Broad Locations of Growth / Regeneration Areas
Table 1: Broad Locations of Growth / Regeneration Areas
|
Regeneration Areas |
Size (ha) (approx) |
Plan Period Uplift |
Post Plan Period |
% of total RA (within Plan Period) |
|
City Centre |
||||
|
Southern Gateway (RA9) |
126 |
3000 |
2000 |
50.00% |
|
Westgate (RA1) |
28.6 |
500 |
8.33% |
|
|
Thornton Road (RA3) |
25.5 |
250 |
4.17% |
|
|
Commercial and Leisure District (RA2) |
21.5 |
150 |
2.50% |
|
|
Manchester Road (RA5) |
25 |
100 |
1.67% |
|
|
Knowledge Quarter (RA4) |
25.3 |
100 |
1.67% |
|
|
Little Germany (RA6) |
9 |
250 |
4.17% |
|
|
Leeds Road (RA8) |
44 |
250 |
4.17% |
|
|
Forster Square (RA7) |
38 |
650 |
10.83% |
|
|
City Centre Totals |
342.9 |
5250 |
2000 |
|
|
Shipley (RA11) |
30.5 |
250 |
250 |
4.17% |
|
Keighley (RA10) |
57 |
500 |
500 |
8.33% |
|
Holme Wood (RA12) |
196 |
0.00% |
||
|
283.5 |
6000 |
750 |
100.00% |
3.1.54In some cases, delivery outputs are forecast beyond the plan period for these areas including Southern Gateway, Shipley and Keighley. The anticipated land supply from Regeneration Areas (RAs) is derived from both historic trend data and forward trend analysis and detailed within the Housing Technical Paper. The individual components and definitions of the RAs is detailed within the settlement policies for Bradford City Centre, Bradford South-East (Holme Wood), Shipley (part of the Regional City) and Keighley.
3.1.55The breakdown of sites under construction and with planning permission together with housing allocations and applied forecasts for anticipated supply within Regeneration Areas is detailed within the Housing Technical Paper and also links to the distribution of growth analysis for the Local Plan.
3.1.56The site allocations and regeneration area components of the land supply include an applied ‘allocations and allowances buffer’ (6%), which effectively equates to the provision of land supply in excess of the minimum housing requirement in recognition of:
- Maximising housing choice.
- Ensuring that the 5-year housing land supply position can be maintained beyond plan adoption.
- Noting that some sites may slip in delivery beyond the plan period or be developed for alternative uses in areas of marginal / changing land use viability.
- Urban regeneration and progression of land scale PDL might need to be initially facilitated through public sector funding with changes in availability and priorities across the city region.
3.1.57The combined land supply equates to circa 33,677 units and from this total the housing requirement of 33,669 is deducted leaving a small surplus.
Further Analysis of Land Supply
3.1.58From a review of the sites and overall land supply it is recognised that there is a gap between the identified housing requirement and level of housing that can be accommodated within non-Green Belt locations. This gap is in the region of 7,000 dwellings and detailed below within Table 2 which applies the land supply buffer.
Table 2: Land Supply – Overview
|
Components of Land Supply (Non-GB) |
Yields |
|
Sites Under Construction and with Planning Permission (discounted) |
6,839 (A) |
|
Windfall (net of completions) |
3,300 (B) |
|
Broad Locations of Growth (not discounted) |
6,000 (C) |
|
Stock of Non-Green Belt Allocations (not discounted) |
12,001 (D) |
|
Total Supply |
28,140 (A+B+C+D) |
|
Housing Requirement Plus Supply Buffer |
33,669 + 1502 = 35,171 |
|
Gap |
Circa 7031 |
|
Allocation Surplus |
8 (outside settlements) |
|
Total |
7,039 (outside settlements) |
3.1.59Table 2 sets out the overall level of gap between the housing requirement and land supply within settlements but does not explain the process involved in arriving at this position. Work on the land supply and overall site assessments has been subject to the following rigorous processes:
- The application of a brownfield and vacant land ‘first’ approach to the identification of land supply following the considerations set out in the site assessment methodology paper. Maximising the use of previously developed land also forms part of the overall spatial strategy for the Local Plan and a key focus for Regeneration Area activity and investment priorities. It’s a central theme and focus for the Plan.
- Also applying a ‘regeneration first’ approach to challenging brownfield sites within the city centre which are central to unlock to support infrastructure and housing growth but require investment in remediation and flood risk mitigation and management alongside key transport infrastructure projects. The Local Plan does not shy away from the challenges of delivering complex large scale brownfield regeneration sites through a strong City Centre policy and plan ambition.
- A detailed review of site density calculations involving the following:
- An evaluation and updated range of density criteria in consideration of different locational characteristics from village and suburban locations, through to town, city edge and inner-city environments.
- Sites have been cross-referenced against the criteria and assumptions used within the DfT Connectivity Tool to recalculate site yields where this was feasible and there was scope to increase and modify density assumptions.
- Sense checking sites against the proximity to key public transport corridors and hubs including rail stations and bus routes and connections. The overall outcome of this approach informs Policy HO2, which ensures that site options within settlement boundaries which are well served by public transport are fully optimised.
- A further deep dive back into the land supply database to revisit marginally rejected and discounted PDL and other sites within settlement boundaries for additional allocation options complaint with site assessment criteria – in some cases this provided some site options which have been included at a later stage in the housing trajectory – classified as developable but not deliverable.
- One site is also identified as a Major Developed Site (MDS 1) in the Green Belt for 150 units.
3.1.60The Sustainability Appraisal has also considered a series of spatial growth options including further urban intensification (brownfield and greenfield) within settlement boundaries and the findings from this analysis are summarised below in Table 6, but essentially these options negatively impact on the retention of services and facilities within urban areas, impact on retaining quality design and places and reduce the range of land uses to support communities and sustainable development.
3.1.61In light of the land supply gap, formal notification was given to neighbouring authorities through established and evidenced co-operation within the Leeds City Region as to whether any Councils could accommodate some or all of the Bradford’s emerging identified need for development which could not be accommodated within settlement boundaries and non-Green Belt locations. No neighbouring authorities have been able to meet this need in part or in full.
3.1.62The Council has exhausted options to meet its housing requirement within settlement boundaries and exceptional circumstances exist to justify the release of Green Belt land for housing development which totals within the region of 6,889 dwellings.
3.1.63In compliance with the Framework para 148, where it is necessary to release Green Belt land for development, plans should give priority to previously developed land, then consider Grey Belt which is not previously developed, and then other Green Belt locations. However, when reviewing Green Belt boundaries, the need to promote sustainable patterns of development should also determine whether a site’s location is appropriate.
3.1.64The Bradford District Green Belt Study (2026) provides a robust assessment of land parcels and wider Green Belt considerations, and this has been used to inform site prioritisation when evaluating Grey Belt and Green Belt allocations and changes to the Green Belt. The outcomes from this assessment are that 76% (5,318 units) of the housing yield in the Green Belt is located on land classified as Grey Belt and Grey Belt Provisional (subject to NPPF Footnote 7 considerations) with the remaining 24% (1,721) on Green Belt sites. Allocations on classified Green Belt land equate to about 5.11% of the overall total housing requirement (33,669).
3.1.65Table 3 below provides a split of the allocation yields only by non-Green Belt and Green Belt and percentage by type across the plan areas. It is noticeable that both the Regional City and Airedale have a percentage of non-Green Belt sites over 70% which reflects the nature and characteristics of their urban areas. While the the South Pennine Towns and Villages and Wharfedale percentages indicate the limited number of sites within settlement boundaries.
Table 3: Split in non-Green Belt and Green Belt
|
Non-GB |
GB |
Totals |
% Splits (non-GB) |
% Splits GB |
Totals |
|
|
Regional City |
9280 |
3944 |
13224 |
70.18% |
29.83% |
100.00% |
|
Airedale |
2085 |
647 |
2732 |
76.32% |
23.68% |
100.00% |
|
Wharfedale |
24 |
678 |
702 |
3.42% |
96.58% |
100.00% |
|
SPT&V |
612 |
1620 |
2232 |
27.42% |
72.58% |
100.00% |
|
12001 |
6889 |
18,890 |
||||
|
Other (MDS1) |
0 |
150 |
150 |
0.00% |
100.00% |
100.00% |
|
12001 |
7039 |
19040 |
Housing Trajectory
3.1.66The condensed housing trajectory for the Local Plan period is contained within Appendix 13 and is split into broadly the same components of land supply detailed above. It is presented in a per annum delivery forecast model and graph covering:
- Under construction and planning permissions (labelled small sites, U/C sites and Permissioned Sites)
- Site Allocations
- One Major Developed Site in the Green Belt
- Windfall less clearances
- Regeneration Areas (Allowances)
3.1.67This forward trajectory has factored in delivery start dates based on date permission was granted, site specific infrastructure requirements and information provided by site promoters against the annual delivery rates used in site assessment work such as the Strategic Housing Land Assessment and 5-year Housing Land Supply Statement. It should be noted for Year 1 of the plan period (2025/26) records factual information on delivery.
3.1.68The graph shows two lines to indicate the annual housing need targets. One is the Standard Method (SM) target (1872), and the other illustrates the same need boosted by the 20% buffer asset out in the 5-Year Housing Land Supply Statement. The graph indicates a clear current deficit in deliverable supply against the plan requirement but with a significant overall supply uplift from Year 6 (2030/31).
3.1.69On Plan adoption it is likely that some of the site allocations will have come forward as planning permissions before the start of Year 6 of the Plan to meet the targets being considered or approved after the Plan base date and it should be noted that these begin to appear in the trajectory from as early as 2026/27. The Council is forecasting a positive 5-year housing land supply position on plan adoption, subject to application of buffers, and positive progression on land supply within the wider macro-economic climate.
Distribution of Housing Growth – Previous Directions and Outcomes
3.1.70The Local Plan (Regulation 18) reviewed the Core Strategy distribution approach and reprised a broad approach to determining distribution of housing growth based upon as series of principles and policy directions[8]:
- Ensure that housing growth is where possible concentrated on areas where the need is greatest i.e. where the population and household growth is focused and where there is a need to provide additional affordable housing.
- The need for new homes is met in a sustainable way which supports the district’s economy and reflects planned changes in infrastructure.
- Distribution maximises the benefits of development (for example making good use of brownfield land and securing investment and improvement in key regeneration areas) and reflects the importance of different regeneration programmes.
- Distribution minimises environmental impacts.
- Housing distribution is deliverable and reflects the realities and constraints of land supply.
3.1.71The headline distribution of growth figures (as a percentage of the district wide total) for the Regulation 18 stage of the Local Plan are note below:
- Regional City – 72.5%
- Principal Towns – 12.1%
- Local Growth Centres – 10.4%
- Local Service Centres – 5%
3.1.72The principles and directions established at Regulation 18 are still reasonable and have been further tested as part of finalising the Local Plan. The grouping of settlements and their classifications within the settlement hierarchy have also been updated and simplified to reflect changing population variables, an update to services and facilities analysis and other sustainability criteria and to assist with completing further work on the Green Belt Study evidence.
Further Testing the Approach to Distribution
3.1.73Following the original distribution methodology, the Council has revisited the base line, policy neutral distribution of the housing requirement. This can then be used to compare against and develop options which more fully reflect the realities of land supply and environmental constraints and the opportunities for regeneration and urban transformation and which in turn allow development pressures to be directed away from more sensitive locations. The updated population proportionate model which profiles distribution based upon the population of grouped settlements is detailed below in Table 4.
Table 4: Baseline Analysis – Population Proportionate Model
|
Settlement Hierarchy (Grouped Settlements) |
Baseline Population Estimate |
% of Total |
Land Supply Outputs (excluding Windfalls) (32,060) – Profiled by Population % |
|
Regional City |
365,208 |
67.98% |
21,794 dwellings |
|
Towns |
117,732 |
21.92% |
7,028 dwellings |
|
Villages |
54,260 |
10.10% |
3,238 dwellings |
|
Population Totals (within settlements only) |
537,200 |
100% |
32,060 dwellings |
3.1.74In common with earlier analysis this ‘policy off’ baseline position does not factor in:
- Regeneration and investment intent for the Regional City and Keighley (and towns more generally) – the most sustainable locations for housing growth, which have excellent services and facilities and transport infrastructure compared to lower tier settlements.
- The practicalities of land supply and the evaluation of site options.
- Strategic land constraints and opportunities as set out through the Bradford District Settlement Study (2026).
3.1.75Following the evaluation of the updated land supply and strategic constraints for the revised plan period as emerging through the SLA 5 (2026) and Site Assessment and the further enhanced strategy focus upon maximising growth and regeneration opportunities linked to infrastructure investment in the Regional City and Keighley this has cumulated in a total land supply position of 32,060 units (excluding net Windfall).
3.1.76The preferred option maintains a balanced approach to growth – maximising sustainable brownfield development options and regeneration potential while ensuring that the settlements across the district identified in the settlement hierarchy as sustainable locations for growth have a level of growth proportionate to their size, function, services and facilities and strategic constraints as set out in Policy SS1.
3.1.77The distribution of this supply compared with the Regulation 18 percentage splits (roughly applied to the revised settlement hierarchy) is set out in Table 5.
Table 5: Comparing Distribution of Housing
|
Settlement Hierarchy (Grouped Settlements) |
Regulation 18 re-apportioned |
Dwelling Profiled Outputs |
Preferred Option |
Dwellings Outputs |
|
Regional City |
72.5% |
23,244 |
72.02% |
23,090 |
|
Towns |
12.1% |
3,879 |
17.42% |
5,586 |
|
Villages |
15.4% |
4,937 |
9.93% |
3,182 |
|
Outside of Settlements |
0.63% |
202 |
||
|
Total (within settlements only) |
100% |
32,060 |
100% |
32,060 |
3.1.78The revised settlement includes an increased number of classified towns (with a combined distribution of circa 1,672 units) and conversely a reduced number of villages. If applied this would rebalance the Regulation 18 apportionment and percentages.
3.1.79In short, the outcome of the settlement distribution is very similar to the earlier plan position. This reflects a broadly common set of principles and priorities carried forward but it is applied to an updated range of supply over a different time period.
3.1.80The Sustainability Appraisal explores a number of strategic growth options as Reasonable Alternatives to the preferred plan option (level of growth and spatial distribution), which are summarised in Table 6.
Table 6: Strategic Growth Options: Reasonable Alternatives
|
Reasonable Alternatives |
Summary |
|
RA1A: Urban Intensification through further development of Previously Developed Land |
Option prioritises the redevelopment of previously developed (brownfield) land within existing urban areas. |
|
RA1B: Urban Intensification through a mix of additional urban sites |
This option also focuses on development within existing settlements but includes a wider range of sites, including undeveloped urban land. |
|
RA2A: Urban Edge Expansion around the Regional City |
Option focuses additional growth around the edge of the Bradford urban area on greenfield sites. |
|
RA2B: Urban Edge Expansion across the District |
This option spreads urban edge growth more widely across Bradford, the district's towns and larger settlements. It tests a more dispersed pattern of development. |
|
RA2C: Urban edge expansion without reliance on Regeneration Areas |
Option follows the same overall approach as RA2B but assumes less housing delivery reliance from regeneration areas. As a result, a greater proportion of growth would need to be accommodated on identified development sites around settlements. |
|
RA3A: Grey-Belt Led Strategy |
This option places greater emphasis on the use of identified Grey Belt land. Development would be focused on locations considered to make a more limited contribution to Green Belt purposes. |
|
RA3A: Grey-Belt Led Strategy without the reliance on Regeneration Areas |
This option follows the same broad approach as RA3A but assumes less housing delivery reliance from regeneration opportunities. A greater proportion of development would therefore be accommodated through the release of Grey Belt sites. |
Meeting Employment Land Requirements
3.1.81The Employment Growth Paper (EGP) (2024) and Employment Land Review (ELR) (2024) plus the Employment Land Review Addendum (ELRA) (2026) and other related technical economic papers including monitoring data provide the context and rationale for the calculations of the employment land requirements for the Local Plan. The plan adopts a hybrid approach utilising the latest available economic forecasts, historic employment land delivery data where relevant and the wider regeneration and economic policy context.
Economic Forecasting
3.1.82In summary the ELRA utilised the latest release of the Regional Economic Model (REM) from February 2025 but consistent with the November 2024 UK macroeconomic forecast to provide a new baseline forecast of employment growth by economic sectors. Over the Plan period this was indicating an annual average forecast of 1,628 jobs compared with earlier REM forecasts (December 2022) of 1,111 per annum - reflective of the depressed economic forecasting period at the time. The new REM baseline of 1,628 is towards the upper end of higher growth scenarios reviewed in the 2024 studies (1,682) and therefore it was not considered reasonable to introduce another level of growth in excess of the new baseline.
3.1.83While the revised REM baseline level is maintained (1,628 jobs per annum), the ELRA includes the development of an alternative adjusted scenario on sectoral job forecasts which included the following changes:
- Job uplifts:
- Information and communication and professional and other private services to align with the earlier 2024 higher growth (mid-point) scenario and reflecting in part the Council’s economic growth plan priorities
- Transport and storage sector – reviewed as potentially below market trends.
- Manufacturing sector (reflecting national economic policy focus on reindustrialisation strategy)
- Jobs reductions:
- Public services – which was considered significantly above trend in the forecasts
3.1.84When the adjusted alternative jobs forecast scenario is translated in gross land requirements for the plan period this equates to the following broad employment land needs:
- Offices (E(g)9i) - 14.6ha
- R&D (E(g)(ii) - 3.6ha
- Industrial (E(g)(iii) / B2 – 8.1ha
- Storage and Distribution – 44.5ha
- Total requirements = 70.8ha[9]
Historic Take-up
3.1.85As part of the land need calculations a review of historic employment land take-up rates has been undertaken, tracking back the past 5 and 10 year periods and then an estimate of gross land requirements calculated looking forward. The more stable longer term (10 year) take-up rates revealed a forecast forward land requirement for Industrial (E(g) (iii) / B2 uses in the region of 47.8ha.
3.1.86Table 7 below combines the offices, R&D and storage and distribution alternative scenario economic forecasts with the industrial historic take-up 'forecast forward' estimate to calculate the overall gross land requirements, which total 110.5ha. This is the employment land need for the Local Plan over its plan period. Further information on the technical calculations is included in the ELRA (2026) together with technical papers.
Table 7: Gross Land Requirements
|
Scenario |
Gross land (Ha) |
||||
|
Office E(g)(i) |
R&D E(g)(ii) |
Industrial E(g)(iii)/B2 |
Storage or Distribution B8 |
Total |
|
|
Hybrid Scenario |
14.6 |
3.6 |
47.8 |
44.5 |
110.5 |
Components of Employment Land Supply
3.1.87To meet employment land needs, the land supply is broken down into a series of components similar to housing supply and the data is extracted from the Council's employment land monitoring database to the base date of the Local Plan (1st April 2025). Table 8 sets out the overall quantum of employment sites under construction and with extant planning permission by use class. The land supply from these types of supply totals about 19.38ha. The largest component of supply is from B8 (Storage and Distribution) at about 52%.
Table 8: Employment Sites Under Construction and Extant Planning Permissions (1st April 2025)
|
Under Construction and Planning Permissions |
||||||
|
Sources of Supply |
Eg(i) (Offices) (ha) |
Eg(ii) (R&D) (ha) |
Eg(iii) (General Industrial / Residential Compatible) (ha) |
B2 (ha) (General Industrial) |
B8 (ha) (Storage & Distribution) |
Total |
|
Sites under construction and forecast to deliver within the plan period |
0.16 |
0.2 |
0.94 |
0.84 |
2.28 |
4.42 |
|
Sites with extant planning permission and forecast to deliver within the plan period |
0.11 |
0.13 |
0.95 |
5.93 |
7.84 |
14.96 |
|
Sub-Total (A) |
0.27 |
0.33 |
1.89 |
6.77 |
10.12 |
19.38 |
3.1.88The Council has adopted a rigorous approach to employment site assessment looking at a wide range of criteria in common with the housing site assessment and focused upon constraints within the broad groupings of the natural and historic environment, environmental protection and water, highways and transport and deliverability. From a working list of 159 employment site options this was filtered down to 19 preferred site allocations.
3.1.89In general terms employment sites are limited by topography and often access constraints and the Plan has moved away from a sub-area allocation approach to a less restricted district-wide strategy recognising the wide variety of business needs across Bradford. There are limited practical employment site options at scale in the district and no significant alternative employment allocation strategies without undermining environmental and housing objectives.
3.1.90The Plan includes a strong focus upon the role of Employment Zones within the district (Policy EC2) in supporting and retaining business development together with other traditional employment areas. Employment land monitoring has indicated a trend towards the intensification of employment space – in which businesses further develop floorspace or take advantage of land holdings to expand within existing employment areas and land.
3.1.91The intensification of employment land plays an important but more modest role in meeting employment needs – forecast to be just under 10ha during the Plan period. Table 9 below brings together an understanding of site yield from land intensification plus non-Green Belt employment land supply and a Major Developed Site (MDS2) in the Green Belt at Esholt which forms part of the former sewage treatment works. This combined land supply equates to 64.27ha.
Table 9: Combining Employment Land Supply
|
Site Allocations and Employment Land Intensification |
||||||
|
Sources of Supply |
Eg(i) (Offices) (ha) |
Eg(ii) (R&D) (ha) |
Eg(iii) (General Industrial / Residential Compatible) (ha) |
B2 (ha) (General Industrial) |
B8 (ha) (Storage & Distribution) |
Total |
|
Sites Allocations (non-Green Belt) |
2.82 |
0.40 |
0.81 |
12.25 |
11.32 |
27.6 |
|
MDS2 |
3.59 |
4.84 |
4.84 |
8.29 |
5.53 |
27.09 |
|
Forecast Employment Zones Intensification Uplift |
0.43 |
0 |
4.7 |
4.45 |
9.58 |
|
|
Total |
6.84 |
5.24 |
30.89 |
21.3 |
64.27 |
|
3.1.92Combining the totals from Table 8 and 9 results in a total land supply of 83.65ha which is just under 27ha short of meeting employment land needs for the Plan period.
3.1.93The Council has repeatedly reviewed its employment land supply options over many years, including through call for sites and land intensification in settlement areas and also approached neighbouring authorities to consider through strategic co-operation across the Leeds City Region whether its unmet employment land needs in part or full could be accommodated within reasonable proximity to Bradford. No authorities have been able to meet this request.
3.1.94The Council therefore considers exceptional circumstances exist to release a limited amount of strategically well-located employment land on two sites within the Green Belt to meet local employment needs. These are:
- E57 - Land North of Westgate Hill and West of Tong Lane – gross site area of 9.06ha (Green Belt) but a net site area contribution to employment land of 5.44ha
- E157: Nufarm South – gross total site allocation of 40.03ha but a gross site area of 34.66ha (Green Belt) and a net site area contribution to employment land of 22.12ha.
3.1.95Nufarm South is a strategic scale employment site and well positioned near M62. J.26 and E57 is located near existing employment and within close proximity to allocated new homes towards the east of Holme Wood. These sites make up the remaining components of the employment land supply which combined with the other sources total 111.21ha - just over the forecast employment need of 110.5ha. Employment site allocations are included within the relevant settlement areas, including Bradford South East for South for E57 and E157.
Links
|
Strategic Objectives |
|
|
Key Policy Links |
|
|
Evidence Base |
|
POLICY ST1: DELIVERING SUSTAINABLE DEVELOPMENT Comment
- The Council will through its plans, strategies, investment decisions and regeneration programmes support the delivery of achievement of the three sustainable development objectives. In particular:
- Proposals which support the economic strength of the district by allocating sufficient land for new employment uses, by pursuing regeneration programmes and investment in the Regional City and its major centres, and by securing new and transformational investment in its infrastructure;
- Proposals which promote environmental improvements and/or objectives by the inclusion of a suite of policies designed to protect, conserve and enhance the natural and built assets of the District, develop healthy places and provide opportunities for recreation, by focusing development in its main urban areas and by investing in public transport infrastructure in the process, reducing the need to travel by car and reducing climate change emissions; and;
- Proposals which meet the housing needs of the District’s growing population, promote high-quality design, and develop healthy places with access to a network of green spaces which enhance the built environment, provide opportunities for sport and recreation and take action to tackle air quality problems
- The Council will work proactively with applicants to find development solutions which can improve the economic, social and environmental conditions of the Bradford District and ensure that that these proposals can be approved wherever possible.
- Developments which maximise the redevelopment of previously developed land and buildings, reduce the need to travel or mitigate against further climate change will be supported, subject to compliance with other relevant policies in the plan.
Explanation
Introduction
3.1.96The purpose of the planning system is to contribute to the achievement of sustainable development.
3.1.97This involves ensuring that the pattern of development meets the needs of the area whilst achieving improvements to each of the three key objectives – economic, social and environmental.
The Presumption in Favour of Sustainable Development
3.1.98The policies of the Local Plan provide a positive planning framework for guiding development and change. When considering development proposals, the Council will take a positive and proactive approach that reflects the presumption in favour of sustainable development in particular to developments which reuse previously developed land and or lie in areas with good public transport links/areas which are well served by local services to reduce the need to travel.
Supporting the Objectives of Sustainable Development
3.1.99Sustainable development involves building a strong and competitive economy and supporting this through the identification of land for development together with supporting infrastructure. The District has many attributes – a rich array of historic buildings, a tradition in manufacturing and industrial innovation, a young and diverse population and strong performance in new business start-ups.
3.1.100Securing new development, investment and regeneration will not only provide the jobs and prosperity which will support local people but will also help increase market confidence and improve viability. In doing so, the ability of the District to meet its needs within and on the edge of its urban areas in the most sustainable locations, through the recycling of brownfield site and development intensification, will grow through the plan period.
3.1.101The spatial strategy which focuses the majority of development on its main urban areas including Regional City together with investment plans such as the delivery of rail station improvements and new mass transit infrastructure will help reduce the need to travel and achieve modal switch to public transport and significantly improve the connectivity of the district. When combined with policies to improve the location and quality, type and range of new homes, reducing flood risk and in adopting low carbon technologies, the district’s ability to mitigate and adapt to climate change will be enhanced.
3.1.102The policies of this Plan for the achievement of the environmental aspects of sustainable development include measures to retain and enhance natural assets improve biodiversity and further develop green and blue infrastructure networks which also link to Settlement and Site Policies within Section 5.
3.1.103The social element of sustainable development involves supporting strong and vibrant communities through the provision of new homes, promoting high-quality design and places accessible to local services and facilities and green spaces. The Council places considerable importance on improving health and well-being and this is reflected in policies focused upon creating well designed and healthy places.
3.1.104The Council has adopted an approach to identifying, comparing and selecting development sites for housing and economic development in this Plan which will support the three sustainable development objectives, in particular by allocating sites which will support regeneration and or the use of previously developed land and by ensuring that a sequential approach is taken which directs development away from areas of high flood risk.
Links
|
Strategic Objectives |
|
|
Key Policy Links |
|
|
Evidence Base |
|
Policy ST2: Sustainable Movement and Connectivity Comment
Strategy for Transport
- The Council will support the transformation of the transport network to progressively encourage more people to travel by more sustainable modes including walking, cycling and public transport, and freight to be transported by sustainable means such as rail and low / zero carbon vehicles.
Transport Schemes
- To achieve an effective transport network that facilitates sustainable movement, the Council will support a wide range of transport schemes as set out in the Local Infrastructure Plan and where possible, mapped out in Appendix 18.
Priority projects and initiatives include:
- Northern Powerhouse Rail – New City Centre Rail Station
- Northern Powerhouse Rail – Enhanced Rail Connectivity
- Bradford Forster Square Station Gateway Redevelopment
- West Yorkshire Mass Transit
- Zero Emission Buses
- Thornton Road – Phase 3 Improvements
- Wharfedale Greenway
- A650 Connect: Wakefield Road/Tong Street
- Kings Road Connect
- Bradford to Shipley Route Improvement Scheme (BSRIS)
- Corridor Improvement Programme (CIP) Programme – A6177 Toller Lane
Transport Approach
- Alongside the delivery of transport infrastructure, the transport needs of the District will be met through:
Demand Reduction
- Maximising the efficient use of land by building to highest possible densities, especially near public transport hubs and sustainable transport corridors as set out in Policy HO2. Additionally, it will be important to promote a mix of uses to provide access to local services, thereby reducing the need to travel.
- Support the delivery of coordinated freight consolidation services and enabling infrastructure. Additional detail is provided in Policy TR5.
Modal Shift
- Acting to provide walking and cycling networks that are coherent, direct, safe, comfortable and attractive. This includes supporting the delivery of more sustainable streets, quiet lanes ways and the integration of green infrastructure. These changes will make it easier and more convenient to participate in active mode choices. Additional detail is provided in Policy DS4 and TR4.
Future Mobility
- Supporting the delivery of infrastructure for sustainable vehicle technologies, such as on-street public EV charger points (as outlined in the Climate Change Action Plan (2025-28)), EV charge points for new homes (see Policy TR3: Parking) and any infrastructure that allows for the consolidation or decarbonisation of freight (see Policy TR5: Freight).
- Delivering mobility hubs, facilitating interchange and greater interconnectivity between modes at locations which enable different public transport and active modes to complement each other in line with Policy I1 of the West Yorkshire Local Transport Plan (2025), and any subsequent updated policy.
- Supporting the delivery of infrastructure to support electric vehicles, car clubs, other hire schemes and charging stations, to facilitate update of electrically assisted pedal cycles, electrically assisted scooters, and other light modes of transport classes as ‘Micro Mobility’.
Explanation
Strategy for Transport
3.1.105The West Yorkshire Local Transport Plan (2025) and West Yorkshire Connectivity Infrastructure Plan (2021) set out a programme for how the District’s transport network will be transformed from one of car dominance to a more equitable and environmental one that emphasises travel by walking, cycling and public transport, and freight to be transported by rail and low / zero carbon vehicles. The Council and its partners will deliver a range of transport infrastructure projects over the plan period to allow for this transformation to take place.
3.1.106There is a clear need to provide an integrated land use and transport planning strategy to form policies which provide a framework for sustainable transport across the District for at least the next 15-20 years. To achieve this, there will need to be a significant change in how we plan for development growth which reduces the need to travel, and where travel is undertaken by the most sustainable means possible. The Council is committed to managing the impacts that transport has on the natural and built environment to create positive outcomes for both. The Council considers that the integrated approach anchored through Policy ST2 and Policies TR1-5 will assist in creating a more sustainable transport network that prioritises movement by walking, cycling and public transport by focusing development in locations well-served by public transport or close to a range of services.
3.1.107Through a transport system which has been created, partly as the result of concerted and contrived action to place the automobile at the heart of people’s lives, and partly as the result of inaction to protect space for sustainable transport over time, many people in Bradford District find it hard to travel without a car, and congestion on roads is high. The current situation is not only unsustainable from a climate perspective but is also very exclusive: in too many places in the District, people are excluded from travel if they do not have access to a car, creating transport poverty. We must create an environment where people find it preferable to travel without a car, as this is the only way of achieving a fair situation for all to travel. To achieve this, we will introduce measures aimed at achieving a sustained and progressive move away from private vehicle use.
3.1.108There are key infrastructure projects which will help create a transport network where the behaviour of people and businesses can adapt to more sustainable ways of getting around, as set out in the Local Infrastructure Plan. These projects will enable a step-change in the quality of transport provision both within our District and to neighbouring areas, by low-carbon, highly efficient modes of transport.
3.1.109This policy framework gives a high degree of priority to projects which enable cycling, seeking to integrate all parts of the District with high-quality, segregated cycling routes conforming to the latest design standards. These will offer equal opportunities for all to travel by zero-emission transport and will need to be met with complementary programmes of activity to maximise their use. A similar effort will be needed to make walking an enjoyable, safe activity through a thoughtfully constructed fine grain of footways, particularly in high demand locations such as our City Centre.
3.1.110The policy ambitions give a high priority to establishing high-quality public transport priority routes, to ensure fast and reliable journey times for bus, and later mass transit. Mass transit is an ambitious, high-capacity, large-scale public transport system in the West Yorkshire metropolitan area which can provide a step change in quality for local journeys and make travelling by public transport a first choice for many. This new system will be integrated into the urban fabric of every community it serves and stops on the system will create anchors for dense, sustainable development – such as traffic-free urban developments as described in TR3 Parking – where owning a car is unnecessary, as it is today in Bradford City Centre.
3.1.111Policy ST2 in the Plan establishes the main principles of the Council’s approach to tackling key transport issues and forms the strategic approach to creating a sustainable transport network for the District.
3.1.112The Council will require applicants to demonstrate how development proposals will contribute to a sustainable transport network through a number of mechanisms, including integrating walking and cycling improvements with connections to existing networks, supporting the economy of the bus network through development form and massing, and showing ambition for a low level of car use which is reflected in parking levels, additional detail is provided in Policies TR2, TR3 and TR4.
Transport Schemes
3.1.113The Council is planning a suite of transport schemes for delivery to enable sustainable, inclusive growth that improves the lives of people residing, working and visiting Bradford District.
3.1.114To meet ambitious climate change commitments and support the energy transition of the transport sector, as well as providing better connectivity for communities in the district, the Council is prioritising the timely delivery of key rail infrastructure, to support the movement of people and goods. In particular, the delivery of Northern Powerhouse Rail and associated rail improvements is foreseen, with necessary adaptations to include new stations that effectively knit the rail network into local communities.
3.1.115Mass Transit is a project covering the whole West Yorkshire metropolitan area which enables inclusive growth, boosting productivity and tackling the climate emergency simultaneously. The project is expected to be spread over the years covered by this plan and beyond and will slowly re-shape local transport networks around high-quality, high-capacity public transport.
3.1.116To provide additional capacity and quality to strained public transport networks, and in the knowledge that environmental and social imperatives require greater demand to be placed on these, the Council is delivering dedicated public transport priority infrastructure. This consists of bus lanes, junction improvements and other intermediate solutions between conventional bus and rail, which will provide arteries for people’s day-to-day transport journeys and act as catalyst for transit-oriented development. These projects are aimed at boosting public and sustainable transport within Bradford city. They will increase capacity for access to employment centres through road space reallocation and reduce conflict between road users, while reducing the environmental impact of transport by lowering carbon emissions.
3.1.117The Council is currently delivering a range of highways and junction improvement schemes many of which will be well progressed or completed by the time the Local Plan is adopted – these are not currently shown on the Policies Map.
3.1.118In an effort to manage and improve the existing highways, public transport, walking and cycling networks, which will deliver the aspirational growth proposed through the Local Plan and other regeneration initiatives, the Council will support, safeguard and prioritise a programme of strategic improvements, as per Policy TR1 – Safeguarding.
Transport Approach
3.1.119The main principles of the Council's transport approach are Demand Reduction, Modal Shift and Future Mobility.
Demand Reduction
3.1.120Demand reduction is required to not only free up capacity on the transport network, but to also reduce travel related emissions, and the impact upon human health and the natural environment. Reducing people’s need to travel will allow more walking, cycling and public transport and the opportunity to deliver car-light and car-free developments.
3.1.121The Council will require applicants to demonstrate how development submitted for planning permission are proposed at the highest possible densities. Development densities will be expected to be maximised at in-centre locations and those close to public transport hubs. This is further covered in housing policy HO2.
3.1.122Freight to and from the District is mostly carried by truck and van, which while vital, poses constraints on the road network, discouraging active travel and creating a maintenance burden As per policy TR5, the Council will support the delivery of freight infrastructure that facilitates freight consolidation and sustainability, such as consolidation centres, freight-controlled areas, rail freight depots etc. This will reduce the impact of freight on the environment.
Modal Shift
3.1.123While reducing the need for travel is a key aspiration, for many people travel is inevitable to access workplaces, education, leisure and other amenities. To manage increasing demand within finite space, energy and environmental constraints, mode shift must be prioritised, with a focus on bettering quality of life. When well planned, travel is an enjoyable experience that contributes to quality of life, with active travel contributing most strongly to this. Those who cycle or walk to work consistently report that their commute is an enriching experience, whereas those who drive to work most consistently regard it as a stressful experience.
3.1.124The Council will encourage the creation of a built environment which prioritises walking, cycling and public transport usage and reduces the dominance of private motor vehicles. This will be done in a number of ways, such as excess vehicle accommodation being removed, reduced vehicle speeds, integrating green infrastructure into the street scene and creating socialising spaces. The Council will require applicants to demonstrate how proposed new developments integrate the principles of sustainable and healthy streets and thus prioritise walking, cycling and public transport usage.
Future Mobility
3.1.125We are seeking to improve the mix of fuels that are used to power transport. There is a great potential for smaller vehicles to be electrified to reduce fossil fuel consumption. There is also a need to shift heavier, larger vehicles away from using fossil fuels, with electric, battery and hydrogen having potential.
3.1.126The Council plans to support the delivery of infrastructure for more sustainable vehicle technologies; electric vehicle charging points. New developments will be expected to integrate EV charging points. The Council will support the development of new on and off-carriageway charging points for road vehicles and bikes.
Links
|
Strategic Objectives |
|
|
Key Policy Links |
|
|
Evidence Base |
|
POLICY ST3: Climate Change, Sustainability and Resource Use Comment
Developments should minimise their greenhouse gas emissions in order to contribute to achieving the District-wide target of net-zero carbon emissions by 2038, and the wider UK target by 2050.To achieve this, applicants should:
- Incorporate adequate and relevant carbon reduction, mitigation, adaptation and resilience measures to address any likely climate change impacts.
- As part of an iterative design process, undertake an appropriate and proportionate carbon assessment of their proposed development to gain an understanding of the likely carbon emissions and identify measures which can be incorporated into the scheme to reduce any residual emissions and achieve net-zero where possible.
Specifically, for each of the themes below, development proposals should:
Health and Wellbeing
- Ensure that through their climate mitigation and adaption measures, they enhance the health and wellbeing, equity and resilience of the District’s communities, taking account of the West Yorkshire Climate Risk Assessment.
Location of Development and Transport
- Follow the settlement hierarchy and be located:
- in areas which are close to services and facilities and/or
- in areas where there are opportunities to access sustainable transport modes, including walking, cycling and public transport.
- Improve access to sustainable transport options including walking, cycling and public transport.
Circular Economy Principles and the use of Resources and Materials
- Adopt circular economy principles in both design and construction.
- Make the most effective use of land, through the conversion of existing buildings, reuse of previously developed land, and minimise the need for demolition.
- Ensure the use of sustainable building materials, including the reuse of reclaimed and recycled materials where possible.
- Minimise waste and maximise recycling during construction and operation.
Energy and Infrastructure
- Maximise and achieve high levels of energy efficiency through the use of appropriate materials and insulation.
- Reduce the need for energy for lighting, heating and cooling by utilising natural light and shading, ventilation and solar gain through their design, orientation and layout (such as Passive design).
- Include and/or access renewable and low carbon energy technologies, such as solar PV, heat pumps which provide both low carbon heating and cooling, wind turbines and, where feasible, heat networks. Community energy initiatives will be supported where there is evidence of community involvement and leadership. The choice of energy technology must also have co-benefits for local air quality where development is located close to populated areas.
- Include the provision of refuelling infrastructure for low/zero-emission vehicles.
Water Environment
- Be located in areas of low flood risk.
- Reduce flood risk through the introduction of sustainable drainage systems (SuDS) and natural flood risk management schemes.
- Manage the water environment and the potential impacts of drought, by minimising water consumption through the use of water efficiency measures and maximising the use of water recycling measures such as rainwater capture, grey water re-use and SuDS.
Protection from Heat
- Be designed to keep people cool, including passive cooling measures, such as natural shade and consideration of building orientation and design to support a cool room within the structure.
- Design scheme layouts, Green and Blue Infrastructure and open spaces to help minimise wildfire risks.
Green and Blue Infrastructure
- Contribute to carbon sequestration and aid urban cooling and shading, by incorporating Green and Blue Infrastructure such as: areas of green space and green corridors; landscaping that prioritises native, drought-resistant, and pollinator-friendly species, tree planting and retention of existing trees; green roofs and walls; and SuDS.
Biodiversity and Habitats
- Protect biodiversity by facilitating the management, restoration, enhancement and expansion, of vulnerable habitat types: primarily blanket bog, other peatland and woodland, which are important for carbon sequestration, and ensuring a net gain in biodiversity.
- Consult the Local Nature Recovery Strategy to identify where and how to create and enhance habitats to help wildlife, achieve wider environmental and climate benefits and other co-benefits.
- Improve soil health and management to enable better storage of carbon within soils, using practices such as minimising soil disturbance, avoiding soil compaction and erosion through careful site planning and construction practices.
Explanation
Introduction
International and National Directions
3.1.127The NPPF makes it clear that the planning system should support the transition to net zero by 2050. Net zero refers to achieving a balance between the amount of greenhouse gas emissions produced and the amount removed from the atmosphere.
3.1.128In particular, the planning system should help to shape places in ways that contribute to radical reductions in greenhouse gas emissions, minimise vulnerability and improve resilience. The PPG indicates that planning can help increase resilience to climate change impacts through the location, mix and design of development. It also indicates that local climate change risk assessments can be carried out to identify the climate risks from severe weather events which the planning system can address through development.
3.1.129More generally, the challenges of climate change and a lower carbon future provide the opportunity to stimulate business innovation and specialisation. It is important that businesses adapt to the challenges of climate change as it will be critical to ensuring their future resilience and competitiveness. The shift to a lower carbon future also has the potential to generate economic growth and development, creating jobs and encouraging inward investment. Integrating measures to address climate impacts can help businesses to reduce cost, increase resilience and enhance reputation.
3.1.130The Planning Act 2008 introduced a duty for local plans to address climate change. In particular, it indicates that policies should be designed to secure development that contributes to the mitigation of, and adaptation to, climate change. Key challenges identified in the Act are: securing progress against the UK’s emission targets, delivering the ambition of zero carbon development, and shaping sustainable communities that are resilient to climate change. In June 2019, an amendment was made to the 2008 Climate Change Act requiring the government to reduce the UK’s net emissions of greenhouse gases by 100% relative to 1990 levels by 2050.
3.1.131The Climate Change Act also requires the government to set legally-binding ‘carbon budgets’ to act as stepping stones to the 2050 target. A carbon budget sets a cap on the amount of greenhouse gas emissions which the UK can emit over a five-year period. The seventh carbon budget was set in 2025 for the five-year period 2038-2042 and is 535MtCO2e. Planning will play an important role in contributing to meeting this target through the implementation of this policy.
3.1.132The Intergovernmental Panel on Climate Change (IPCC) has advised that global warming should be limited to a 1.5oC increase in order to avoid catastrophic effects. The UK government is a signatory of the Paris Agreement, a legally binding international treaty adopted in 2015 which aims to limit global warming to well below 2°C (ideally 1.5°C) above pre-industrial levels. Under this agreement the UK has an interim goal of achieving a 68% reduction in greenhouse gas emissions by 2030 compared to 1990 levels.
Regional and Local Directions
3.1.133At a sub-regional and local level, both the Council and the wider Leeds City Region have declared a Climate Emergency and have formed a Climate Coalition which aims to achieve a net zero carbon region by 2038, with significant progress being made by 2030. This is an accelerated and ambitious target to meet and will require significant changes in behaviour and the way places are planned and developed.
3.1.134The West Yorkshire Combined Authority (WYCA) has prepared a Climate and Environment Plan[10] (including an Emission Reduction Pathways study) to help establish how to decarbonise major sectors in the City Region, including power, buildings, transport, industry, land-use and agricultural. Taking forward the measures in this study will require a significant step-change in the requirements placed upon new development and the behaviours of communities across the Bradford District.
3.1.135A key action for WYCA from the Climate and Environment Plan was to prepare a Climate Risk Assessment[11]. This document provides an understanding of how climate change could affect people, places, nature, infrastructure and services across West Yorkshire. It groups the risks and vulnerabilities under five themes: health and wellbeing; the built environment; land, nature and food; infrastructure; and economy. It also looks at the opportunities which may be presented from a changing climate and how these can be best realised. The potential for climate change to disproportionately affect vulnerable groups within the community is a key risk, so mitigation and adaptation measures should take account of the wider equity impacts.
3.1.136At a local level the Council has prepared a Climate Action Plan (CAP) (2025-2028)[12] which outlines how the District will respond to the Climate Emergency and the measurable pathways to achieving the 2038 net zero target. The CAP provides evidence of the District’s baseline greenhouse gas emissions by sector and looks at the trends overtime. It identifies key priorities and measures for achieving net zero under the ‘Future Ready Pathway’. These priorities include: Transforming Travel and Transport; Increasing Renewable Energy and Fuels; Decarbonising Industry; Growing a Sustainable and Inclusive Economy; Providing Warm and Comfortable Buildings; Enabling Community Climate Action; Managing Land and Nature; Reducing Consumption and Waste. The policies in the Local Plan will help to contribute to, and deliver, these climate action priorities. In conjunction with the CAP, the Council has developed a Developer Sustainability Checklist and Statement to help applicants comply with the requirements of this policy and ensure climate impacts are considered at an early stage in scheme design. Appendix 10 of the plan provides details of the checklist.
3.1.137The Council has also worked closely with the District’s manufacturing businesses as part of the Bradford Manufacturing Futures project. This project is helping the District’s businesses adapt to meet both national and global decarbonisation goals whilst maintaining competitiveness.
Use of Carbon Assessments
3.1.138One way of ensuring that new development makes a positive contribution to achieving the local and national climate goals is for applicants to carry out a carbon assessment of their proposal. Carbon assessments can take one of two forms: either a detailed whole-life carbon assessment or one which concentrates on the operational carbon emissions only. When choosing which assessment to carry out, it will be important to take a proportionate approach, having regard to the type and scale of the development proposed.
3.1.139The purpose of a carbon assessment is to calculate the likely carbon emissions from a proposed development (either as part of a whole-life carbon assessment (which includes embodied carbon) or an operational carbon assessment) and then demonstrate how these can be minimised through the introduction of relevant measures. There are a number of tools available which developers can use to undertake these calculations, although the Council is not endorsing or mandating the use of a specific tool. Applicants are encouraged to refer to the RICS Whole Life Carbon Assessment guidelines[13].
3.1.140It is recognised that each site and development is different and the carbon assessment should be used to aid the design process and decide which measures are best to incorporate to reduce carbon emissions. The assessment can be used to demonstrate to the Council that the resulting carbon emissions have been reduced as much as possible.
Location of Development and Transport
3.1.141It is important that new developments follow the settlement hierarchy and, where possible, are within close proximity to key services and facilities. Such an approach will reduce the number of journeys and consequently reduce the emissions emitted from transport use.
3.1.142The proximity of new development to public transport, walking and cycling routes is also a key consideration as this provides options for people to use more sustainable forms of transport, again helping to reduce emissions from the use of fossil fuel combustion-engine vehicles. Developments should also take opportunities to link into such networks and routes and/or enhance them.
3.1.143Consideration also needs to be given to the provision, location, and roll-out of public electric vehicle charging infrastructure, public e-bike hubs and other mobility infrastructure. By including and/or contributing to the provision of such infrastructure, developments can improve access to it, aiding the take-up of electric vehicles and helping to reduce the reliance on fossil fuel combustion-engine vehicles, which in turn will help to reduce emissions.
Circular Economy Principles and the use of Resources and Materials
3.1.144A circular economy looks to minimise waste by maximising the life of resources by promoting reuse, recycling and regeneration of buildings and their components or materials. Products and materials are kept in circulation through processes like maintenance, reuse, refurbishment, remanufacture, recycling and composting. The circular economy tackles climate change, biodiversity loss, and waste and pollution by decoupling economic activity from the consumption of finite resources. The three core principles of a circular economy are: eliminate waste and pollution; circulate products and materials; and regenerate nature.
3.1.145The reuse of existing buildings and the redevelopment of previously developed land help to ensure the most effective use of land. Demolition of existing buildings is heavily discouraged as it can lead to the release of embodied carbon, is resource intensive, and produces waste that needs to be processed and may lead to further emissions. Where demolition is necessary (due to existing building condition), the materials arising from the demolition should be reused and recycled. This may include the reuse of non-contaminated excavated soil and hardcore within the site.
3.1.146The use of recycled building materials is encouraged where this would help to minimise carbon emissions. Likewise, developments should be planned in a way which ensures the waste generated through construction is kept to a minimum, and the principles of a circular economy should be embedded into the design and construction process.
Energy and Infrastructure
3.1.147The CAP states that Bradford aims to switch all energy sources to renewable alternatives, leveraging local renewable installations like domestic solar panels and large-scale projects such as solar farms or wind farms. This would align with the government’s Clear Power 2030 Action Plan[14] which sets a goal of achieving 95% clean power by 2030. The Bradford Local Area Energy Plan[15], prepared by WYCA on behalf of Bradford Council, sets out a technical evidence base which identifies decarbonisation opportunities across the District up to 2040. Applicants should consult the Local Area Energy Plan (LAEP) to understand these potential opportunities and ensure alignment with them where appropriate.
3.1.148This Local Plan policy sets out the overarching principles for energy infrastructure in new developments. Applicants should use the energy hierarchy[16] in the design of their schemes: by looking to increase energy efficiency in the first instance through the use of insulation and appropriate building materials, followed by connection to heat networks where these exist or can be developed as part of the scheme, then the use of renewable technologies. Community led renewable energy initiatives may play a role in delivering energy provision at a neighbourhood level and could provide a holistic place-based approach to future energy provision.
3.1.149Where developments are located close to existing populations the choice of energy infrastructure must provide local air quality co-benefits and would mean limiting the use of biomass or other solid fuel technologies. The Bradford Clean Air Plan and Air Quality Management Area (AQMA) assessments should also be consulted to ensure that energy infrastructure choices do not exacerbate local air pollution issues.
3.1.150The design and layout of new developments can also play an important role in reducing the need for energy for lighting, heating and cooling by considering the orientation of properties to maximise solar gain. However, consideration also needs to be given to the different times of year and whether maximised solar gain in winter could cause overheating issues in summer. Measures such as the provision of shutters and other elements, including Green Infrastructure to provide shading, should form part of the design process.
Water Environment
3.1.151The NPPF is clear that new development should avoid areas of flood risk. Climate change is likely to increase the frequency and intensity of rainfall events which in turn may result in increased flooding. To adapt and mitigate to these potential impacts, new developments should contribute to managing the water environment. Natural Flood Management techniques should be used to help aid flood alleviation. This includes the use of Sustainable Drainage Systems (SuDS) to collect and store water in times of heavy rainfall and slow the flow of that water back into the river network. The Environment Agency’s national Working with Natural Processes[17] mapping[18] can also be used to understand the best types of interventions which can be employed in particular locations, it includes looking at floodplain reconnection, tree and woodland planting, and natural attenuation measures.
3.1.152Climate change also causes longer drier periods of weather which in turn can lead to droughts, wildfires, and pressures on the water supply and water environment. To ensure the resilience of communities in the future, it is important that new developments include water efficiency measures to help minimise water consumption. Grey water recycling, rainwater capture and SuDS all have a part to play in securing the water environment.
Protection from Heat
3.1.153The country is seeing periods of intensifying heat that, with recent record hot summers (such as 2018, 2022 and 2025) becoming more normal, puts pressure on agricultural production and poses challenges for keeping vulnerable people sufficiently cool. Heatwaves bring with them rising potential for drought and wildfire risk. This has significant consequences for wildlife, water supply and fire damage.
3.1.154It will be important at the design stage of any proposal to consider the risks posed from rising heat and heatwaves. New buildings should be designed to keep people cool from the outset. Low -cost passive cooling measures, such as natural shading and green infrastructure provision, may provide sufficient mitigation. In other cases, more active mechanical interventions may be required.
Green and Blue Infrastructure
3.1.155Green and Blue Infrastructure plays an important role in helping to mitigate against the impacts of climate change. The planting of new trees and woodland, and other vegetation as part of landscaping schemes can help to sequester carbon and provide shading to help reduce the urban heat island effect. It can also play a part in regulating the water environment and local temperatures. The Council has prepared a Green and Blue Infrastructure Strategy (GBIS)[19] which provides analysis of the current provision of Green and Blue infrastructure and identifies areas of need where new provision is required. It also sets out key actions and potential future projects. Applicants should consult the GBIS to gain an understanding of the required levels of provision, with development proposals being designed to include the relevant Green and Blue Infrastructure in accordance with the standards set out in this plan. Developments should also prioritise the use of native, drought-resistant, and pollinator-friendly plant species to support local ecosystems and reduce maintenance demands.
Biodiversity and Habitats
3.1.156The UK is one of the most nature-depleted countries, with habitat loss and intensive agriculture having devasted ecosystems and caused biodiversity decline. The District has extensive areas of countryside which include important habitats, including valuable peatland, moorland and woodland. This natural infrastructure helps to absorb and lock up carbon. The degradation of such areas can lead to the release of additional carbon emissions. To prevent this, these areas need protecting, enhancing and managing. Local habitat restoration can be used to support this as well as helping to reverse biodiversity loss and reduce flood risk. This can also contribute to meeting the government’s 30by30 target[20] to protect 30% of land and sea for wildlife by 2030. Also, in line with other policies in the plan, development proposals should make net gains in biodiversity and where appropriate support local habitat creation and restoration.
3.1.157The West Yorkshire Local Nature Recovery Strategy (LNRS)[21] has been prepared to help achieve the targets set out in the Environment Act (2021) to restore and enhance nature across England. The LNRS identifies nature-recovery priorities and suggests specific practical measures to achieve these. There is an accompanying map which pinpoints where restoring, creating or enhancing habitat could be particularly important. Developers should consult with the LNRS to help design and shape their developments, identifying appropriate habitat restoration, enhancement or creation measures.
3.1.158The Government’s Land Use Framework[22] highlights some of the current issues in balancing the use of land, indicating that there is enough land to build homes, maintain food production, restore nature and build clean power. However, the resilience of the land is under pressure, and worsening soil health is a key issue to be addressed. Soil plays an important role in storing carbon and this can be undermined by poor management and competing pressures on land use. The Department for Environment, Food and Rural Affairs (DEFRA) has published a code of practice for the sustainable use of soil on construction sites[23]. This provides advice on the use and protection of soil in construction projects. Developers should have regard to this when planning their schemes. Managing the soil resource can provide multiple ecosystem and climate benefits.
Links
|
Strategic Objectives |
|
|
Key Policy Links |
|
|
Evidence Base |
|
POLICY ST4 – CREATING WELL DESIGNED AND HEALTHY PLACES Comment
- Development proposals will be supported that:
- contribute to the creation of well designed, healthy places that are sustainable, safe, inclusive, accessible and distinctive;
- enable healthy active lives through the design and arrangement of buildings, streets, spaces and uses;
- deliver high-quality Green and Blue Infrastructure and streets together with open spaces, in line with Policies ST6, NE1, NE2, DS2, DS4 and SC5;
- develop high-quality housing and employment opportunities and supporting infrastructure that enable healthy, active lives and reduce health inequalities between areas and within communities;
- maximise connectivity to sustainable and active travel modes and help improve local areas.
Well Designed and Healthy Places
- Support the delivery of high-quality places through Policies DS1-DS4,HO8and TR2 by:
- creating places with a local identity, understanding and responding to the District’s positive and varied character, culture, heritage and topography and positively respond to adopted Neighbourhood Development Plan policies, in line with Policy DS3;
- incorporating active design and travel principles while allowing for access for all, particularly children and older people providing attractive, routes that facilitate safe walking, wheeling and cycling for everyone, on everyday journeys, in line with policies DS4 and TR4;
- providing environments for living, working and visiting which are easy for all to use, reduce opportunities for crime and provide focal spaces for social interaction, community and cultural events;
- supporting the diversification of uses and local amenities in line with Policies TC1-TC4 within retail centres and neighbourhoods, to prevent and reduce the over concentration, and over-exposure of residents, particularly children, to uses with negative physical or mental health impacts;
- protecting allotments within developments and supporting new community food and allotment provision in line with Policy NE2 to enable people to access and produce healthy food and create a positive food environment.
- supporting the provision, protection and improvement of multifunctional, Green and Blue Infrastructure, linear linkages and corridors, open spaces and nature rich, beautiful places connecting people to nature, in line with Policies ST6, NE1 and NE2, DS2 and DS4;
- supporting the provision and protection of inclusive, high quality, safe play spaces for children and young people, allowing for all age play and intergenerational use of both formal play areas and public spaces, in line with policies NE2 and DS2;
- seeking improvements that minimise exposure to environmental hazards and pollutants, improve air quality with reference to Policies CR1 and CR2 and do not harm the amenity of existing or prospective users and residents, including effects such as noise, smell, loss of daylight, privacy and visual character, and through appropriate arrangements for the storage of waste;
- designing places and buildings that are adaptable to emerging weather patterns and changing circumstances and needs, particularly in relation to accessibility and climate resilience, to ensure they will function well over the long term, in line also with policies HO8, CR2, CR3 and CR4;
- working in partnership with health authorities to maintain and improve access to the full range of health services for residents, including through the co-location of health facilities with other community facilities, referring also to Policy SC4.
Health Impact Assessments
- Proposals for developments of 50 housing units (C3) or more, or for non-residential developments of 10,000 sqm or more, and proposals of any size for new takeaways and fast-food restaurants, betting shops, high interest and payday loan shops should include a Health Impact Assessment (HIA). The HIA should demonstrate how any adverse health impacts will be effectively mitigated and how the positive health impacts of the proposal will be maximised.
- Outside the above thresholds if a development proposal is assessed against sections 1 and 2 of this policy and other referenced policies and has potential for negative impacts on health or an increase in health inequalities, the Council can also request a HIA.
Explanation
3.1.159This strategic policy considers communities and sustainable development, alongside the Local Authorities’ responsibility under the 2012 and 2022 Health and Social Care Acts to meet local health and wellbeing needs and reduce health inequalities.
3.1.160The policy pulls together a number of closely aligned design, transport and infrastructure policy areas as an integrated approach to supporting the delivery of well-designed and healthy places.
Context
3.1.161Bradford is one of the most deprived areas in England, and the health of its residents reflects that. Healthy life expectancy varies by up to 23 years between the most and least deprived parts of the District. Almost half of the population lives in the most deprived 20% of postcodes[24]. Reducing health inequalities is a key priority in the Local Plan and tackling health deprivation and its impacts is supported by a strong local partnership of health practitioners and organisations.
3.1.162Parts of Bradford District have some of the highest rates of childhood illness in the UK. Born in Bradford is a major research initiative and series of studies, following children’s wellbeing from birth, to help understand the factors that underlie child ill-health. A wide range of partners and communities work together to improve child health and well-being and reduce child health inequalities. This policy supports that work by putting communities and children and young people at the heart of creating healthier places.
Why Healthy and Well-designed Places Matter
3.1.163Healthy and well-designed places ensure that changes and opportunities for improvement in the built and natural environment support our mental, physical and emotional wellbeing, bringing wider benefits to communities. The health of some groups in society, for example, children and young people, older people, people living on low-income, people with health conditions or disability can be more affected or disadvantaged by exposure to avoidable health risks and hazards. Box 1 below provides a snapshot of health inequalities in Bradford and challenges faced.
Box 1: Health Inequalities in Bradford
Life expectancy varies by 10 years for men and 8 years for women across wards in Bradford District and Craven.
Healthy life expectancy gaps are even more stark. Women in parts of central Bradford can expect just 49 years of healthy life compared to 72 years in Wharfedale, a difference of 23 years.
For men, healthy life expectancy varies from 51 to 71 years, a 20-year gap.
Other health inequalities experienced by the Bradford population include –
- Preventable mortality is significantly higher than the England average in 17 of Bradford's 30 council wards
- Smoking rates vary from 8% to 24% across the 13 Community Partnership areas (overall 18%)
- Two thirds of adults are overweight or obese; obesity rates for children are above the national average
- Asthma admissions in 0-9 year olds: 279.1 per 100,000 (Bradford) vs 172.7 (England).
Sources: Bradford District and Craven HCP Strategy, September 2025 and Bradford Teaching Hospitals Health Inequalities Statement 2025/26
3.1.164The District has a legacy of supporting good design through the Homes and Neighbourhoods – A Guide to Designing in Bradford SPD, Design Code Pathfinder work and innovation in public space and landscape design. This policy builds upon some of this work but also aligns with policies DS1-DS4.
Local Amenities, Spaces and Play
3.1.165In areas with fewer community facilities and local amenities such as parks and other assets people can miss out on activities and opportunities that support and improve our everyday and long-term health and wellbeing. Most people in Bradford District live in urban areas with greater health needs, significant health inequalities and, in some cases, a poorer quality of built environment.
3.1.166Children and young people have a legal right to play and need to be active every day to build and maintain good health and mental wellbeing. Our built and natural environments play a key role in this. In some of our urban areas there is relatively little green or play space for the population size and a relatively high proportion of the children live in urban areas. All these factors together shape our health and wellbeing, particularly that of children and young people – especially in the all-important early years and teenage years when development and growth again accelerate – but also the opportunity for all of us to stay active and healthy as we age.
3.1.167Design of new developments can facilitate safe doorstep play for younger children. Play provision must include a range of small, car-free, defended spaces very close to family homes to enable younger children to play out under adult supervision, particularly for any family properties without gardens, and properties out of sight of play spaces on a development.
3.1.168Local Public Health Area Profiles show that many of the more urban areas of Bradford District, where rates of deprivation and ill-health, including poor mental health are higher, have limited access to open and natural spaces. High-quality local neighbourhoods and built environments, with inclusive communal spaces will support mental wellbeing, enabling people to stay active, social and part of their community. Poor quality developments that lack shared spaces and assets can limit social connections and interaction, becoming a limiting factor to community life.
Green Spaces and Tackling Deficits
3.1.169Open space analysis and work on the Bradford District Green and Blue Infrastructure Strategy 2026 indicates a series of ‘focus areas’ of infrastructure deficit and areas for improvement within the Regional City and a large corridor stretching through Airedale west to Keighley. These are further detailed within Policy ST6.
3.1.170Access to green space for play and leisure shapes children and young people’s health and wellbeing. It supports health and mental wellbeing throughout the life course, enabling people to remain active. Research highlights the link between the provision and access to green and blue spaces and health outcomes.
Healthy High Streets and Centres
3.1.171High streets and local centres still remain at the heart of many communities. A healthy ‘high street’ should:
- Be inclusive of people from all walks of life;
- Be easy to navigate and include crossings;
- Provide shade, shelter and places to stop and rest;
- Be walkable and provide options for cycling;
- Have low levels of noise and air pollution;
- Provide things to see and do;
- Have a health-promoting retail offer;
- Ensure people feel relaxed and safe; and
- Consider the local context of the high street, its features and current use, and how all these factors interact with one another[25].
Transport Infrastructure and Health Outcomes
3.1.172Decisions about type, design and location of roads and public transport infrastructure shape whether or not people must drive all or most of their journeys. The age and quality of housing and access to green space shapes our exposure to both positive and negative factors for health and wellbeing. Negative factors include exposure to poor air quality, to heavy traffic, noise nuisance, the health risks of living in cold, damp or unsafe housing and lack of opportunity for being physically active in everyday life. Positive factors include easy and safe access to high-quality local amenities such as play facilities, parks and gardens, community and neighbourhood assets.
3.1.173Access to well-connected active travel corridors can provide a positive health option for local trips, commuting, travelling to places of education and work and leisure.
Safe, Inclusive and Liveable Places
3.1.174The design of the built environment can play a significant part in reducing crime, disorder and the fear of crime, including through consideration of:
- Natural surveillance of streets, paths, open spaces, parking areas and entrances;
- A clear definition between public, private and semi-private space.
- Lighting, particularly of streets, paths and spaces;
- Layout of streets and paths and how they integrate with their surroundings, creating clear sightlines;
- Landscape and planting, avoiding hiding places or dark, secluded areas; and
- Security measures which balance the effective protection of premises with maintaining safe, attractive and welcoming street scenes.
3.1.175Further design guidance on safety and security in support of criterion 2C is set out in Homes and Neighbourhoods – A Guide to Designing in Bradford SPD, the Bradford Shopfront Design Guide SPD, and Planning for Crime Prevention SPD. Also relevant is Safer Parks: Improving Access for Women and Girls which is based on research undertaken in West Yorkshire (see Policy DS2). Seeking the advice of the Bradford District Police Designing Out Crime Officer is recommended at the earliest stage of a project.
3.1.176Criterion 2C also supports the design of environments that are accessible and easy for all to use. This includes measures to enable people, particularly those with disabilities, to successfully negotiate streets, public spaces and buildings having regard to factors such as surface materials, street furniture, road crossings, building entrances and circulation space. Seeking the views of local access groups and forums can help in this regard. Further guidance is set out in the Homes and Neighbourhoods SPD, and Policy DS4 sets criteria for inclusive streets. Also relevant is the Dementia-ready Housing design guidelines by West Yorkshire Combined Authority.
3.1.177Successful buildings and places can adapt to changing social, technological, economic or climatic conditions (in line with criterion 2I). Developments can promote adaptability through the flexible layout and form of buildings and spaces, designing them to be capable of being used for a range of activities or possible future uses, or to be easily modified over time. Policy HO8 deals specifically with the accessibility and adaptability of new homes.
3.1.178It’s important that development does not harm the amenity of existing or prospective users or residents, including effects such as loss of daylight, privacy, noise, and visual character as identified in criterion 2H. However, it should be noted that many small-scale employment uses can readily coexist with residential and other uses. It’s important to consider details like how waste will be stored, for instance to avoid bins causing obstruction and clutter in pedestrian areas. Policy HO8 deals with the storage of bins for new homes whilst the Householder SPD provides guidance on how to design extensions to homes without harming the amenity of adjacent residents.
Practical Tools to Deliver Outcomes – Health Impact Assessments
3.1.179The Council and its partners will create healthy places by maximising health and wellbeing gains from development proposals and ensuring that potential negative impacts of development are identified through Health Impact Assessments and designed out or mitigated.
3.1.180The threshold is set at major developments above the medium development sub-set striking the right balance between supporting the aims of the policy to delivery well- designed and healthy places and without being an onerous requirement on smaller schemes, often delivered by SME developers, while allowing the Council to apply sufficient resources to manage a review of submitted HIA material.
3.1.181The tool is particularly important to apply at the early stage in scheme design and masterplanning and guidance is available on how to prepare the assessment.
Links
|
Strategic Objectives |
|
|
Key Policy Links |
|
|
Evidence Base |
|
POLICY ST5: GREEN BELT Comment
- The extent of the Green Belt within the District is defined on the Policies Map and will be maintained.
- Proposals for development located within the Green Belt will be considered inappropriate except where they meet the criteria and requirements set out in the NPPF and Local Plan Policy NE9.
The Golden Rules
- Sites allocated for residential development in this Local Plan which have been released from the Green Belt, and any other major residential development located in the Green Belt which is shown to not be inappropriate, will be required to meet the Golden Rules as set out in the NPPF. These are to make the following contributions:
- the provision of affordable housing in line with the requirements of Policy HO4;
- the necessary improvements to local or national infrastructure;
- the provision of new, or improvements to existing, green spaces that are accessible to the public, including arrangements for the long-term management and maintenance of the spaces provided.
Enhancement of Green Belt land
- Development proposals which increase the beneficial use of the Green Belt, by enhancing green and blue infrastructure, biodiversity, visual amenity and landscaping, or improving derelict land and opportunities for access to outdoor sport and recreation, will be supported where they do not conflict with objectives of Green Belt or other policies.
Grey Belt
- Development proposals in the Green Belt may not be considered inappropriate if they are located on land defined as Grey Belt and meet the relevant criteria in the NPPF.
Explanation
3.1.182The Government attaches great importance to Green Belts, with the general extent of Green Belts across the country having already been established. The essential characteristics of Green Belts are their openness and permanence, with the fundamental aim being to prevent urban sprawl by keeping land permanently open.
3.1.183Green Belts can help to shape patterns of urban development and promote regeneration, by restricting development. The NPPF sets out the five purposes of including land within the Green Belt:
- to check the unrestricted sprawl of large built-up areas;
- to prevent neighbouring towns merging into one another;
- to assist in safeguarding the countryside from encroachment;
- to preserve the setting and special character of historic towns; and
- to assist in urban regeneration, by encouraging the recycling of derelict and other urban land.
3.1.184The Bradford District Green Belt has evolved over time from its initial conception in a number of town plans in the 1960s and the general extent being confirmed in the West Yorkshire Structure Plan adopted in 1980. The detailed boundaries were then comprehensively defined in the first Unitary Development Plan for the District adopted in 1998. Changes to the Green Belt were made in the Replacement Unitary Development Plan in 2005 in order to accommodate the development needs of the District at that time and to secure areas of safeguarded land for the future. The Green Belt in Bradford plays an important role in retaining the character of the district, keeping towns separated, conserving the countryside and concentrating development in urban areas. It is therefore important that the general extent of the Green Belt is maintained.
3.1.185The NPPF clearly indicates that once Green Belt boundaries have been defined, they should only be altered where exceptional circumstances are fully evidenced and justified through the preparation or review of the local plan. Strategic policies should establish the need for any changes to Green Belt boundaries.
3.1.186An assessment of the Green Belt has been carried out to inform this Local Plan. This assessment considers the performance of land designated as Green Belt against the five purposes defined in the NPPF. It shows that the general extent of the Green Belt in the District continues to achieve the fundamental aim of preventing urban sprawl by keeping land permanently open.
3.1.187The Council has demonstrated that exceptional circumstances exist requiring the release of Green Belt land to facilitate and meet the future growth needs of the District. Strategic Policy SS1: Spatial Strategy looks at the overall principles and approach to growth within the district over the plan period and SS2 sets out in more detail, the position in relation to the exceptional circumstances and how the Council has come to this conclusion.
3.1.188Following the changes made to the Green Belt as a result of the need to allocate land for development, it now accounts for 23,481ha, constituting 64% of the District’s land area. Appendix 14 provides a list of the housing and employment allocations that have been removed from the Green Belt.
3.1.189The NPPF indicates that when establishing the need for changes to Green Belt boundaries regard must be had to their intended permanence in the long term, so they can endure beyond the plan period. In order to achieve this, consideration needs to be given to whether areas of safeguarded land between the urban area and the Green Belt, to meet longer-term development needs, should be identified.
3.1.190The site assessment work for this plan has indicated that there are significant challenges in identifying suitable sites for allocation, including through the release of Green Belt land. The identification of further land for safeguarding would require additional releases from the Green Belt. This would likely lead to significant implications, potentially fundamentally weakening the remaining area of Green Belt in the District and have impacts on the landscape and character of settlements and their setting.
3.1.191The Council’s longer-term ambitions for the District are based on comprehensive regeneration of the city centre and wider urban area. This plan establishes the starting framework for this future transformational regeneration both within and beyond the plan period, as set out in Policy BCC1, particularly around the Southern Gateway. It is considered that the designation of safeguarded land is not necessary at this time with future growth in the next plan period being concentrated and accommodated within the existing settlement areas, through regeneration and intensification.
Golden Rules
3.1.192The preparation of the Local Plan has demonstrated that there is insufficient land within existing settlements to meet the anticipated growth needs of the district and that there is a need to release land from the Green Belt. The plan has allocated a number of sites for housing and employment development which were formerly Green Belt land. In line with the requirements of the NPPF, where land is released from the Green Belt for development through plan preparation or review, the Golden Rules should apply. As stated above, those allocated sites released from the Green Belt are listed in Appendix 14 and also identified in the individual site policies.
3.1.193The Golden Rules apply to major housing developments and consist of: the provision of affordable housing; improvements to local or national infrastructure; and the provision of new, or improvements to existing, accessible green spaces.
3.1.194Local Plan Policy HO4 sets out the specified amount of affordable housing to be provided on housing sites which have been removed from the Green Belt, or for other instances where the Golden Rules apply.
3.1.195The accompanying Local Infrastructure Plan, and specific site policies provide an indication of the type of local infrastructure that should be provided to satisfy the NPPF criteria. Proposals should also comply with the relevant CIL charges and contributions required in policies in the Local Plan.
3.1.196The provision of new accessible greenspace, or improvements to existing greenspace, should be in line with the requirements of Policy NE1: Green Infrastructure Standards, Policy NE2: Open Space, Play, Sport and Recreation and the provision standards set out in these policies. The PPG also sets out detailed guidance on how major housing developments can contribute to the provision of accessible greenspace. This includes ensuring that spaces are safe; visually stimulating and attractive; well-designed; sustainably managed and maintained; and meet the needs of the communities which they serve. These spaces should include areas of vegetation which are set within the landscape or townscape, which can include areas of blue space, and which should contribute to the priorities set out in the Local Nature Recovery Strategy. Conditions and/or planning obligations will be used to secure the provision of the space and level of contributions for the long-term management and maintenance of the space.
3.1.197Where proposals for major housing development come forward on Grey Belt land and can meet the relevant exception to inappropriate development as set out in the NPPF, the Golden Rules will also apply.
Enhancement of Green Belt land
3.1.198The NPPF indicates that local planning authorities should plan positively to enhance the beneficial use of Green Belts. It is therefore important that Green Belt land within the District is enhanced where the opportunity arises.
3.1.199The planned release of some land from the Green Belt for development can present opportunities to enhance the remaining Green Belt and access to it. The Golden Rules require the provision of new or improvements to existing green spaces which are accessible to the public, as set out above.
3.1.200The Green Belt could be enhanced through increased access by improvements to public rights of way, landscape restoration programmes, habitat creation linked to Biodiversity Net Gain and the priorities outlined in the Local Nature Recovery Strategy (LNRS), provision and improvements to green and blue Infrastructure, and recreation facilities located in the Green Belt. Local Plan Policy NE9 provides further details with regards to the development of recreation facilities in the Green Belt.
Grey Belt
3.1.201Grey Belt is defined in the NPPF as land which does not strongly contribute to any of the purposes a, b, and d of including land in the Green Belt[26]. The development on such land may not be considered inappropriate if it meets the relevant criteria in the NPPF. The Council’s Green Belt Assessment has been used to identify sites adjacent to, and on the periphery of, settlements which are considered to meet the definition of grey belt land. However, each site proposal will need to be considered on a case-by-case basis to ensure the details of the specific proposal can be properly assessed against the criteria.
3.1.202The Local Plan establishes a five-year supply of housing land at the point of adoption and has therefore met the housing need. Until such a time where the latest monitoring shows that there is no longer a five-year housing land supply, applications for development on grey belt land for new housing will not meet the NPPF criteria and will therefore not be permitted.
3.1.203Proposals for other uses on grey belt land will need to demonstrate an unmet need in line with the requirements of the NPPF. For employment land, consideration will need to be given to the latest Authority’s Monitoring Report and the performance of employment land delivery against the requirements. Where significant under performance is demonstrated this may constitute an unmet need.
Links
|
Strategic Objectives |
|
|
Key Policy Links |
|
|
Evidence Base |
|
Policy ST6: Strategic Green and Blue Infrastructure Network Comment
Strategic Green and Blue Infrastructure Network
- The Council will protect, maintain, enhance and restore a connected, multi-functional Strategic Green and Blue Infrastructure (GBI) network across the District, as defined in this policy and identified in Appendix 15. The strategic network consists of (but is not limited to):
- The South Pennine Moors;
- The River Aire corridor (Airedale);
- The River Wharfe corridor (Wharfedale);
- The Bradford Beck and its tributaries;
- The Leeds–Liverpool Canal corridor;
- Key upland fringe and valley systems linking settlements to the surrounding countryside
Development within the Strategic Green Blue Infrastructure Network
- Development proposals which fall within the Strategic GBI network must avoid harm to the integrity, connectivity, and functionality of the network. Proposals that would result in significant harm which cannot be avoided, adequately mitigated, or compensated for will be refused. Proposals should:
- support the delivery of the Nature Recovery Network and Local Nature Recovery Strategy;
- provide measurable improvements to biodiversity, including delivery of biodiversity net gain in accordance with national requirements;
- contribute to climate change mitigation and adaptation, including urban cooling, carbon sequestration, and natural flood management;
- improve health and wellbeing through access to high-quality green space;
- support active travel and sustainable movement across the District;
- contribute to and align with strategic green and blue infrastructure networks and ecological corridors extending beyond the District’s boundary.
- Particular protection will be afforded to the following key components identified within the GBI network:
- strategic ecological corridors and habitat networks;
- watercourses and their associated corridors; and
- areas performing critical roles in flood risk management.
Addressing Gaps and Opportunities in the GBI Network
- Development proposals should prioritise and actively enhance areas identified as gaps in the GBI network, especially where development occurs within or adjacent to these areas, it will be expected to:
- strengthen physical and ecological connectivity between GBI assets;
- deliver new or enhanced green and blue infrastructure that is multi-functional;
- improve active travel links, including safe and attractive walking and cycling routes;
- enhance ecological corridors to support species movement and habitat resilience;
- address deficiencies in access to green space, particularly in underserved urban areas;
- prioritise interventions, where applicable, that:
- reinforce strategic corridors such as Bradford Beck, River Aire, River Wharfe, and Leeds–Liverpool Canal; and
- restore fragmented habitats and degraded water environments, including culverted waterways
National and Local Context
3.1.204National planning policy places significant weight on the creation and protection of coherent ecological networks, the delivery of biodiversity net gain, climate resilience, and improved access to nature. This policy brings these priorities together spatially through a Strategic Green and Blue Infrastructure (GBI) network.
3.1.205GBI refers to the strategically planned network of natural and semi-natural spaces - including parks, woodlands, rivers, canals, street trees, SuDS features and active travel corridors - that together deliver environmental, social and economic benefits.
3.1.206The Strategic GBI network in the Bradford District comprises a connected system of multi-functional green and blue spaces, corridors, and assets, including:
- designated areas of open space including parks, amenity greenspace, natural greenspace, and outdoor recreation spaces
- biodiversity assets including designated wildlife sites (SPA/SAC, SSSI, NNR, LNR, LWS), wildlife habitat networks, priority habitats, trees and woodland.
- Water Environment: rivers, becks, canals, reservoirs, wetlands, and associated floodplains
- design features such as SuDS, swales, rain gardens, green roofs/walls.
- active travel routes including public rights of way including footpaths, bridleways, cycle routes and greenways
- landscapes and cultural heritage assets including the wider open countryside and areas of Green Belt
3.1.207The District contains a wide range of environmental assets, from internationally important upland moorlands to river valleys and modified urban waterways. These features collectively form a network that underpins biodiversity, manages water, supports active travel, and provides opportunities for recreation and health.
3.1.208Parts of the District, particularly within the main urban area, experience fragmented habitats, constrained green space, and increasing pressures from climate change, including flood risk and urban heat. At the same time, there are strong opportunities to use river corridors, canal networks, and green links to better connect communities and enhance environmental quality.
3.1.209Bradford has secured investment through the Nature Towns and Cities programme, a national initiative aimed at transforming urban environments through high-quality nature-based improvements. This funding supports projects to enhance parks, waterways and neighbourhood green spaces across the District, directly strengthening the Strategic GBI network and accelerating delivery of nature-rich, climate-resilient places.
3.1.210The Council's GBI Strategy identifies the District’s main environmental corridors and landscape systems that provide connectivity between urban areas and the wider countryside. These corridors structure the movement of wildlife, water and people across the District, and are particularly important in maintaining ecological resilience and landscape character. The strategy provides details of the extent, condition and opportunities within the network.
3.1.211This policy should be read alongside other policies in the Local Plan—particularly those relating to biodiversity, climate change, design, flood risk and sustainable transport—which collectively support the protection, enhancement and delivery of the District’s green and blue infrastructure network.
Development within the Strategic Green Blue Infrastructure Network
3.1.212Development is expected to respond positively to its environmental context rather than treating it as a constraint. This means using development as an opportunity to:
- integrate green and blue infrastructure into site design from the outset;
- strengthen links between existing habitats and green spaces;
- contribute to wider initiatives such as the Nature Recovery Network; and
- support healthier, more sustainable communities
3.1.213Particular emphasis is placed on multi-functionality, ensuring that interventions deliver combined benefits—for example, sustainable drainage features that also provide habitat and public amenity, or green corridors that function as both ecological routes and active travel links; in doing so, enhancements to the GBI network can also support the delivery of wider Local Plan objectives, including biodiversity net gain, tree planting and urban canopy cover requirements.
3.1.214The policy also recognises that environmental systems extend beyond administrative boundaries, and therefore encourages alignment with wider sub-regional corridors, particularly along river catchments and moorland edges.
Protection of GBI Network Function
3.1.215For the network to operate effectively, its key components must remain connected and functional. Fragmentation, whether through physical barriers, loss of habitat, or degradation of water environments, can significantly reduce its value. The policy looks to ensure that development does not undermine the role of:
- river corridors as continuous ecological and hydrological systems;
- green links that allow species movement between habitats; and
- areas that play a role in storing or conveying flood water
3.1.216It reflects the principle that avoidance of harm is the most effective approach, particularly in sensitive or strategically important locations. Where impacts do arise, proposals must demonstrate a clear and robust approach to mitigation.
Addressing Gaps and Opportunities in the GBI Network
3.1.217Evidence shows that the network is not uniform across the District. In some locations, particularly in urban areas, there are clear gaps in connectivity, access, and environmental quality. This creates an opportunity for development to make a targeted contribution to improving the network. Rather than piecemeal provision, the focus is on reinforcing strategic corridors and addressing known weaknesses.
3.1.218The GBI Strategy identifies four primary focus areas where there is a high need for GBI but currently suffers from low provision. These areas are:
- Bradford Inner City (the area within the A6177 ring road)
- Bradford Connections (corridors leading out from the city to the wider suburbs including Manningham, Undercliffe, Bradford Moor, Holme Wood, West Bowling, Little Horton and Girlington)
- Keighley
- Keighley-Bingley-Shipley Corridor
It also identified some smaller focus areas including:
- South Bradford around Wyke
- Denholme and its surrounding area
- Areas between Oakworth and Haworth
- Areas to the west of Keighley
- The Wharfedale corridor between Ilkley and Menston.
3.1.219The GBI Strategy sets out a range of opportunities within these areas which developments can help to deliver, and includes:
- integrating street trees along key routes
- creation of community growing spaces
- creation of active travel networks and corridors out from the city centre to the suburbs, and also connecting parks
- seeking opportunities to de-culvert and re-naturalise Bradford Beck
- creating and restoring accessible blue spaces
- restoring sections of the river network including the Aire, Wharfe, Worth and North Beck
- delivering natural flood management
- creating links to the Bradford Pennine Gateway NNR
- expanding semi-natural habitat provision
3.1.220The intention is that incremental improvements delivered through development will, over time, result in a more coherent, accessible and resilient network.
Implementation
3.1.221The policy will be supported by the Council’s GBI Strategy, which:
- refines the spatial definition of the network;
- identifies priority areas for intervention; and
- guides decision-making and investment.
3.1.222Further guidance may be provided to support delivery, particularly in relation to design, biodiversity net gain, and sustainable drainage.
Links
|
Strategic Objectives |
|
|
Key Policy Links |
|
|
Evidence Base |
|
Key Diagram
The Key Diagram (below) illustrates the broad locations of development as set out in the Local Plan together with key features, strategic sites and broad locations for housing growth. The Key Diagram is a diagrammatic representation and should be considered in conjunction with the relevant policies.
Local Plan Key Diagram:
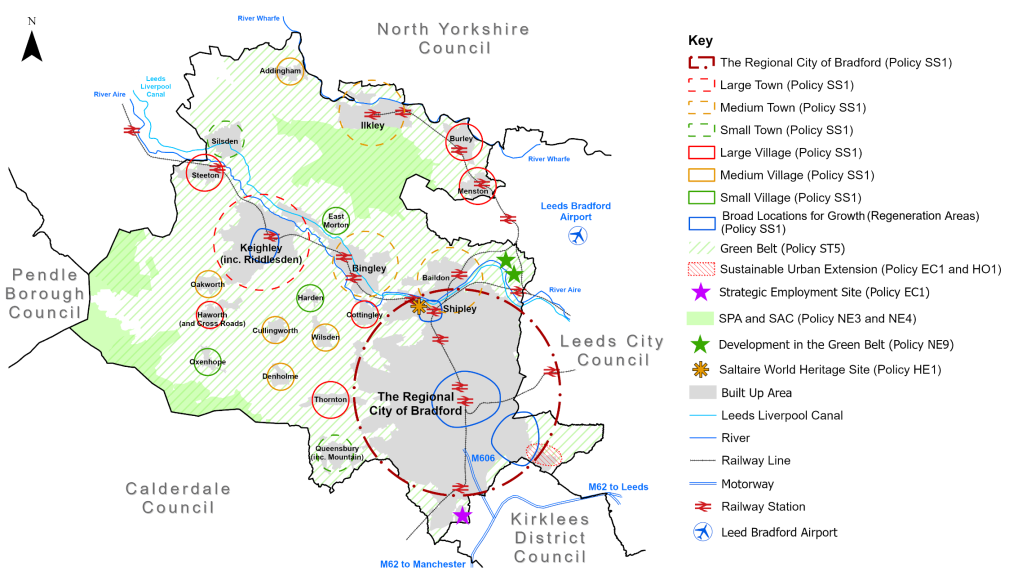
[1] Insight Bradford Core City Analysis and Benchmarking (November 2025)
[2] Edge Economics Employment Land Review Addendum 2026 Final
[3] STEAM 2025 report – UK tourism economic impact model.
[4] Before any approach to discounting is applied in Policy SS2.
[5] Site allocation area is 40.03ha which included non-Green Belt land)
[6] See CBMDC Housing Technical Paper 2026
[7] There is one exception for a site above threshold but below 5 units.
[8] Housing Growth Policy SP8 – Technical Paper
[9] These results include a 20% margin allowance and adjustment for
changing working practices.
[11] West Yorkshire Combined Authority Climate Risk Assessment (2026) (In Progress)
[13] https://www.rics.org/profession-standards/rics-standards-and-guidance/sector-standards/construction-standards/whole-life-carbon-assessment
[15] Bradford Local Area Energy Plan (2026)
[16] As set out in Policy CR3 – Renewable and Low Carbon Energy
[17] https://assets.publishing.service.gov.uk/media/6036c5468fa8f5480a5386e9/Working_with_natural_processes_evidence_directory.pdf
[19] Green and Blue Infrastructure Strategy (2026)
[20] https://www.gov.uk/government/publications/criteria-for-30by30-on-land-in-england/30by30-on-land-in-england-confirmed-criteria-and-next-steps
[21] https://www.westyorks-ca.gov.uk/place/environment-and-regeneration/restoring-nature/?tabindex=1
[23] https://www.gov.uk/government/publications/code-of-practice-for-the-sustainable-use-of-soils-on-construction-sites
[24] Statement taken from https://www.bradfordhospitals.nhs.uk/health-equity/#health-inequalities-in-bradford
[25] https://assets.publishing.service.gov.uk/media/5acf358240f0b617df3358a8/25.01.18_Healthy_High_Streets_Briefing_document_Final_version.pdf
[26] and where the application of policies in relation to assets identified in Footnote 7 do not provide a strong reason for refusing or restricting development (NPPF2024)
